
Meta Ads Cost Per Lead Benchmarks by Industry (2026)
2026 Meta Ads CPL benchmarks across eight industries — average CPLs, seasonal swings, and tactics to improve ROI: prioritize lead quality, video creatives, and fast follow-up.
Meta's Cost Per Lead (CPL) benchmarks in 2026 vary widely depending on the industry:
E-commerce: $27.25 average CPL. Prioritizes purchases over leads.
Real Estate: $51.90 average CPL, with Tier 1 markets seeing $35–$65 CPL.
Home Services: $34.00 average CPL. High-cost subcategories like roofing exceed $115.
Healthcare: $41.60 average CPL. Seasonal fluctuations impact costs significantly. These costs also vary by funnel stage.
Fitness: $29.70 average CPL. Seasonal trends drive lower costs in Q2.
B2B SaaS: $63.40 average CPL, with qualified leads costing $150–$250.
Legal Services: $72.40 average CPL. High competition drives costs up.
Finance: $58.70 average CPL, with niche services exceeding $190.
Key insights:
CPLs rose 5–10% industry-wide due to competition and algorithm changes.
Ad creative quality impacts costs, with video ads and Meta lead forms vs. landing pages driving better results.
Fast follow-up (within 5 minutes) significantly improves lead conversion rates.
Pro Tip: Focus on lead quality over cost. A higher CPL can be worthwhile if it delivers qualified leads that convert.
Meta Ads Cost Per Lead by Industry 2026 Benchmarks Comparison
1. E-commerce
Average CPL
E-commerce brands typically report Cost Per Lead (CPL) figures ranging from $29.00 to $31.00. Establishing benchmarking basics using historical data is vital for contextualizing these figures. However, most advertisers in this space prioritize Cost Per Acquisition (CPA) over CPL, as their ultimate goal is driving purchases rather than just collecting leads. Currently, the average CPA for e-commerce ads on Meta stands at $43.80, though this can vary significantly depending on the specific product category.
CPL Range
The cost of acquiring customers differs across various e-commerce sectors. For instance, Food and Drink brands benefit from some of the lowest acquisition costs, averaging $20.47. Electronics follows closely with a CPA of $22.17. On the higher end, Clothing and Fashion sees a CPA of $28.08, while Beauty and Health faces even steeper competition, with a CPA of $34.29. Across the board, the average conversion rate for e-commerce ads is 1.82%, and the average CPM (Cost Per Thousand Impressions) is $11.54.
YoY Change %
E-commerce CPLs increased by 20% in 2025, and projections suggest an additional 5–10% rise in 2026. This trend is largely driven by growing competition and evolving platform metrics across industries. A notable change is Meta's shift from using "impressions" to "views" as a key engagement metric, which has contributed to these rising costs.
Key Influencing Factors
To keep costs in check and improve performance, high-quality video content is now essential, and choosing the best Meta ad placements can further amplify its impact. Understanding how in-stream video ads perform can help brands optimize these assets for better engagement. Reels alone account for over 40% of Meta ad impressions, meaning that brands without video content risk higher ad costs and reduced engagement and lower click-through rates. Tools like Advantage+ Shopping Campaigns can help, offering a 15–25% reduction in costs compared to manually managed campaigns. Additionally, simplifying campaign structures - by consolidating campaigns - enables Meta's AI to optimize faster and more effectively by exiting the learning phase sooner. These strategies are crucial for maintaining ad efficiency as we delve into benchmarks by objective and placement across other industries.
2025 Meta Ads Benchmarks by Industry (CTR, CPC, CPM, CPL & ROAS)
2. Real Estate
Real estate advertising costs are shaped by unique market dynamics and strict regulatory requirements.
Average CPL
Real estate advertisers face higher costs per lead (CPL) than e-commerce, with projections for 2026 ranging from $54.50 to $57.00, up from $51.90 in mid-2025. While these figures place real estate above many sectors, it remains below industries like legal services and aligns closely with financial services. The extended buying cycle typical of real estate transactions is a key factor driving these costs.
CPL Range
Lead costs vary significantly based on market tier and targeting strategies.
Tier 1 markets (e.g., New York City, Los Angeles, Miami): CPLs range from $35 to $65.
Tier 2 markets (e.g., Austin, Denver, Nashville): CPLs range from $20 to $45.
Tier 3 regions: CPLs are lower, falling between $8 and $20.
When it comes to ad formats, Lead Form Ads deliver better results, averaging $34.10 per lead, compared to $45.80 for Video Ads. To lower these costs, advertisers are increasingly using bulk ad testing to identify high-performing creatives faster.
YoY Change %
From 2025 to 2026, real estate CPLs increased by 5–10%, largely influenced by changes in Meta's algorithms , requiring full-funnel AI optimization to maintain efficiency. Additionally, Cost Per Click (CPC) rose by 7% year-over-year, reflecting growing competition for consumer attention in this space.
Key Influencing Factors
Meta's Andromeda update has shifted focus toward engagement quality, moving away from broad targeting. At the same time, the Special Ad Category (Housing) restrictions have imposed limitations, such as banning targeting by age, gender, and zip code, and requiring a minimum targeting radius of 15 miles. These rules emphasize the importance of creative quality in generating qualified leads.
Targeting audiences aged 25 and older has become a preferred strategy, helping advertisers focus on financially stable prospects. These tailored approaches underline the distinct challenges and strategies required for success in real estate advertising compared to other industries.
3. Home Services
Advertising for home services on Meta strikes a balance between the relatively low costs of e-commerce and the higher expenses associated with premium services. Just like in other sectors, costs in home services fluctuate based on Meta ads benchmarks and user engagement levels and the effectiveness of creative strategies.
Average CPL
By 2026, the average cost per lead (CPL) for home services is projected to hit $34.00, rising from $30.57 in 2025. This places home services costs between the lower end of e-commerce and the pricier legal or financial services categories. However, this average conceals significant differences across subcategories. For instance, high-ticket services like roofing and HVAC installations can see CPLs soar past $115.00, while landscaping services average around $58.56.
CPL Range
Costs vary widely depending on the type of service. For example:
Plumbing and heating services average $72.97 per lead.
Pest control services come in slightly lower at $70.11.
Roofing, gutters, and air conditioning services often exceed $116.75.
When it comes to ad formats, Lead Form Ads outperform video ads, with CPLs averaging $34.10 compared to $45.80. These differences highlight how ad types and service categories influence overall performance benchmarks.
Year-over-Year Change
Between 2025 and 2026, CPL is expected to climb by 11.2%. During this same period, the cost per click (CPC) is projected to increase by 10.6%, reaching $2.30, while conversion rates are anticipated to hit 7.0%. These shifts align with broader Meta Ads CPM benchmarks across the platform. Campaigns specific to construction are likely to see a 9.0% rise in CPL, reaching $45.00 by 2026.
Key Influencing Factors
The rise in costs can be traced back to challenges like creative fatigue and declining audience engagement. According to Adovate Agency:
"Budget amplifies whatever foundation you already have - good or bad".
To counteract these challenges, advertisers are leaning into high-impact visuals, such as before-and-after project galleries and 3D renders, to better capture attention. Additionally, reaching out to leads within five minutes significantly improves close rates. Combining Facebook and search ads has also proven effective, reducing CPL by 3%–29% through audience reinforcement.
4. Healthcare
Healthcare advertising on Meta occupies a middle ground in terms of lead costs, balancing accessibility with the need to meet strict compliance standards. Despite these complexities, many brands advertise on Meta to leverage its massive reach and AI-driven targeting. This industry faces unique hurdles, including regulatory constraints and unpredictable seasonal pricing that can heavily influence campaign budgets, requiring strategic ad scheduling to maintain efficiency. Like other industries, healthcare advertisers must continually refine their creative strategies, often using dynamic creative optimization, to stay aligned with Meta's evolving ad benchmarks.
Average CPL
The average cost per lead (CPL) for healthcare ads on Meta is $41.60. This places it between more affordable sectors like e-commerce, which averages $27.25, and higher-cost industries such as legal services, which reach $72.40. However, global data from March 2025 to February 2026 suggests a higher average CPL of $52.00, making healthcare about 28% higher than the global cross-industry benchmark. This increase stems largely from compliance requirements and the specialized targeting that limits audience size.
CPL Range
Healthcare CPLs show significant variation throughout the year. Costs ranged from $23.26 in January 2026 to $81.34 in November 2025, with an average monthly fluctuation of $11.90. This is more than three times the global benchmark variance of $3.52. Bottom-funnel campaigns, such as those focused on appointment bookings, tend to be the most cost-efficient, averaging $33.15 per lead. In contrast, top-of-funnel awareness campaigns average $51.40. Lead Form Ads are particularly effective in healthcare because they simplify the process for potential patients while adhering to HIPAA regulations. This format allows users to express interest without immediately disclosing sensitive information.
Year-over-Year Change
Healthcare CPL trends reveal a highly variable performance. In January 2025, the CPL was $41.81, but by January 2026, it had dropped to $23.26, marking a 44% year-over-year decrease. However, Q4 2025 saw CPLs spike to nearly $70, a 41% increase compared to the first nine months of the year. These fluctuations obscure mid-year volatility. Additionally, Meta's CPM benchmarks for healthcare surged by 70% year-over-year, climbing from $22.76 in January 2025 to $38.70 in January 2026. This pattern of high Q4 costs followed by a sharp January reset is more pronounced in healthcare than in most industries.
Key Influencing Factors
The healthcare sector's advertising trends reflect its unique challenges. Ads featuring authentic, user-generated content consistently outperform highly polished campaigns, helping to build trust in this sensitive field. Videos led by doctors that address specific concerns not only resonate with audiences but also improve targeting efficiency. However, creative fatigue can set in quickly, prompting top-performing brands to refresh their ads every 7–14 days to maintain steady lead generation. Including qualifying questions in lead forms is also crucial to balance lead volume with quality, especially since healthcare conversion rates on Meta average just 2.84%, far below search ads' 8.09%. Timing is another critical factor - following up with leads within five minutes of submission maximizes conversion potential, while delays of hours or days can significantly reduce lead quality.
5. Fitness
The fitness industry has its own unique rhythm when it comes to seasonal trends and advertising costs. Compared to other sectors, fitness campaigns on Meta are generally less expensive, with costs falling below the cross-industry average. However, this affordability comes with significant seasonal variations. Unlike industries that see a surge in Q4, fitness campaigns often experience their highest costs mid-year. This means advertisers need to carefully plan their budgets to navigate these fluctuations effectively. Using a Meta ads budget planner can help allocate spend across these seasonal peaks. Let’s dig into the details of cost metrics, seasonal changes, and strategies that are particularly relevant to fitness advertising.
Average CPL
For fitness and training centers, the average cost per lead (CPL) is $29.70, which is about 29% lower than the global cross-industry average of $41.50. This makes fitness advertising on Meta one of the more budget-friendly options for lead generation. However, advertisers should still look for ways to reduce Facebook ad costs to maximize their return. That said, costs can vary widely depending on the type of facility:
Budget gyms: CPLs typically range from $8–$15.
Mid-range facilities: Average CPLs fall between $15–$30.
Premium or boutique studios: Costs can climb to $25–$50.
Lead generation ads tend to outperform traffic campaigns in this sector because they allow users to submit their information directly within Meta, making the process smoother and optimizing conversion rates. These cost differences highlight the importance of tailoring strategies based on the type of fitness facility being promoted.
CPL Range
Fitness advertising costs can swing dramatically throughout the year, with an average monthly fluctuation of $7.44 - about 2.4 times the global average. The lowest CPLs are typically seen in April, at $13.50, while July marks the peak at $48.33. This mid-year spike is unusual, as July is the only month when fitness CPLs exceed the global benchmark. On the flip side, April and May offer the best deals, with costs dipping as much as 64% below global averages, making it a prime time for aggressive lead acquisition campaigns. January also stands out, as conversion rates during this month are 40–60% higher than usual, although CPMs rise by 20–30% due to New Year’s resolution campaigns.
Year-over-Year Change
While Meta’s overall lead costs increased by about 20% in 2026, reaching $27.66, the fitness sector bucked the trend with a 20% decline in CPLs. This is a sharp contrast to the rising costs seen in most other industries. Fitness campaigns also benefit from a median click-through rate of 1.63% and an average cost-per-click of $1.92, which is significantly lower than Google Ads’ average of $5.26. These lower costs make Meta an appealing platform for fitness advertisers, especially those focusing on local lead generation.
Key Influencing Factors
Success in fitness advertising on Meta hinges on AI-driven interest targeting and regularly updating creative assets. This process requires a structured approach to avoid common ad testing mistakes that can skew performance data. Meta’s strict policies on health claims and body image mean that ads must avoid making specific promises about weight loss or using overly idealized body types. Instead, authentic user-generated content and partnerships with micro-influencers (10,000–100,000 followers) are proving to be more effective, delivering 30–50% higher conversion rates compared to polished brand ads.
For local gyms, targeting within a 5–8 mile radius is crucial to avoid wasting budget on non-local leads. Timing is also critical - following up with leads within five minutes can increase conversion rates by up to 9x. To combat ad fatigue and rising costs, top-performing fitness brands refresh their creative assets every 2–4 weeks. Additionally, using native lead forms on Meta can boost conversion rates by up to 5x, a key advantage for local gym promotions that rely on quick and effective lead capture.
6. B2B Services
Advertising B2B services on Meta comes with its own set of challenges compared to B2C. The audience is smaller, more niche, and harder to target, which naturally increases costs. While consumer brands often aim for broad visibility, B2B advertisers focus on reaching decision-makers within specific companies. These decision-makers are often part of buying committees with 6–10 stakeholders. Meta's ever-changing algorithms affect all industries, but for B2B, the specialized nature of the audience makes cost and quality hurdles even steeper. While the cost per lead (CPL) is higher, the potential lifetime value of converting the right prospects can make it worthwhile. Let’s break down the typical CPL figures for B2B services and how they differ from consumer-focused sectors.
Average CPL
When it comes to lead generation on Meta, B2B services are among the priciest. On average, B2B SaaS leads cost $63.40, with professional services ranging from $25–$70, and high-end consulting services reaching $315+. These figures vary widely because of the challenge of qualifying leads. General leads are cheaper, but Marketing Qualified Leads (MQLs) or Sales Qualified Leads (SQLs) come with a much higher price tag. For example, qualified B2B SaaS leads typically cost between $150–$250, while enterprise SaaS leads can range from $350–$550. These higher costs are often justified by the significantly larger customer lifetime values in B2B compared to consumer markets.
CPL Range
The cost of B2B leads can vary based on factors like audience readiness and the type of offer being promoted. Campaigns targeting "cold" audiences - those with broad professional interests - tend to have click-through rates (CTR) of 0.6%–1.0%. However, retargeting campaigns aimed at "warm" audiences can achieve CTRs of 1.2%–1.8%. Michéal Breslin of Lever Digital explains:
"A 0.6–1% CTR in B2B can be perfectly healthy if the audience is well defined and the offer is high-consideration".
The type of offer also plays a big role. High-friction offers, like "Get a Demo", generally result in higher CPLs, while lower-friction options, such as ROI calculators or benchmark reports, tend to cost less. These nuances underline the importance of tailoring strategies to specific audience behaviors and needs.
Year-over-Year Change
Even with a 20% increase in overall Meta lead costs in 2026, B2B advertising remains relatively cost-effective. The average CPC for B2B is now $2.52, and CPM for B2B SaaS is around $4.00. Compared to Google Ads, Meta still offers a more affordable option for generating leads, especially for building brand awareness. Michéal Breslin highlights this dynamic:
"In B2B, Meta ads aren't usually the hero of last-click conversions. It's the assist. The amplifier. The channel that builds familiarity before someone types your brand name into Google three weeks later".
This means that success on Meta often goes beyond the platform’s reported CPL. Instead, B2B advertisers should track how Meta campaigns influence their sales pipeline over 30–90+ day cycles.
Key Influencing Factors
As with healthcare and home services, lead quality is critical in B2B, but the stakes are even higher due to the smaller target markets. Using CAPI with first-party data can help optimize for high-quality MQLs and SQLs. Lookalike audiences created from actual customer lists outperform interest-based targeting by 25–40%, making first-party data a key asset.
Creative strategy is also essential. B2B campaigns often perform better when they focus on educational and story-driven content to warm up the audience before introducing direct-response offers. Timing is another critical factor: reaching out to prospects within five minutes can increase conversion rates by up to 9x. Adding custom qualifying questions to native lead forms can further filter out low-intent leads while maintaining efficiency.
7. SaaS
SaaS companies face unique pricing challenges, largely shaped by Meta's ever-changing algorithms. One of the biggest hurdles is managing consistently high and unpredictable Cost Per Lead (CPL). This is due to longer sales cycles, complex decision-making processes involving multiple stakeholders, and the tricky balance between generating lead volume and maintaining lead quality. The average CPL for SaaS sits at $62.71, but monthly fluctuations average around $11.00, making it 3.1 times higher than the global all-industry benchmark. This level of volatility complicates both budgeting and forecasting for SaaS marketers. Understanding ROAS benchmarks is essential for effectively scaling these campaigns.
Average CPL
The cost of acquiring a SaaS lead varies significantly depending on the type of lead. General leads, such as newsletter signups or content downloads, cost around $41.40 on average, while standard B2B SaaS leads are closer to $63.40. For more qualified leads, the costs increase dramatically: Marketing Qualified Leads (MQLs) or Sales Qualified Leads (SQLs) range from $150 to $250 per lead, demo requests cost $80 to $250, and free trial signups fall between $30 and $80.
Alesia Sidaruk from Aimers highlights the importance of prioritizing quality over quantity:
"Optimizing for leads alone can inflate volume but hurt quality. If your goal is sales or revenue, optimizing for deeper funnel conversions is better."
This underscores the need for SaaS marketers to strike a balance. While low-friction forms might seem appealing for generating cheaper leads, they often result in an overwhelming number of unqualified prospects for sales teams to sift through.
Year-over-Year Change
The SaaS industry saw one of the steepest CPL increases in 2025. Between January 2025 and January 2026, CPL surged by 109%, climbing from $37.61 to $78.56. For comparison, all industries experienced a 20% increase, while the global benchmark actually dropped by 1.7% in the same timeframe. SaaS CPLs ranged from a low of $30.32 to a high of $86.79, representing a 2.86x spread. By January 2026, SaaS CPLs were 128% higher than the global average.
Seasonal trends also play a role. Costs are typically at their lowest in Q1 (averaging $36.23), rise in Q3 ($74.50), and peak in Q4 ($78.15). These fluctuations demand targeted strategies to manage costs while maintaining lead quality.
Key Influencing Factors
Lead quality remains the biggest factor influencing SaaS CPL. To address this, many SaaS advertisers are turning to creative-led targeting, which focuses on AI audience profiling, and using conditional logic in Instant Forms to filter out unqualified leads. Leveraging first-party audience data also plays a critical role here: retargeting campaigns for B2B SaaS often deliver 40–60% lower Cost Per Qualified Lead (CPQL) compared to cold traffic campaigns.
Quick follow-up is another essential element. An efficient sales process can justify higher acquisition costs by ensuring leads are converted effectively. On average, B2B SaaS companies spend $1,167 per month on advertising, though those aiming for aggressive growth can spend as much as $9,346. To give Meta's algorithm enough data for optimization, a minimum daily budget of $50 (approximately $1,500/month) is recommended.
8. Legal and Finance
After examining ROAS benchmarks by industry like healthcare and SaaS, the legal and finance sectors emerge with their own set of challenges when it comes to Cost Per Lead (CPL), driven by unique market forces.
These industries consistently face some of the highest CPLs on Meta platforms, largely due to intense competition in ad auctions and the high customer lifetime values tied to their services. Yet, the cost structures and volatility in these sectors differ significantly.
Average CPL
In the finance sector, the average CPL during the 2025–2026 period was $24.82 - around 40% lower than the global all-industry benchmark of $40.99. However, specific niches tell a different story. Financial advising sees CPLs climb to $58.70, while complex B2B FinTech services can range anywhere from $50 to over $190 per lead. Legal services, on the other hand, show a broader range. One analysis places the median CPL at $164.00, while other reports average $72.40. Projections for 2026 law firm lead ads suggest a much lower CPL of approximately $21.00. These variations highlight the wide cost spectrum in these industries.
CPL Range
Finance CPLs typically fall between $13.33 and $37.81, with December often seeing the highest costs. Legal services, however, experience more dramatic fluctuations, ranging from $67.00 to $254.00. A striking example of this volatility is a $123 CPL spike between August and September 2025. Michéal Breslin, Founder of Lever Digital, sheds light on this:
"In sectors like FinTech and SaaS, audience sizes are smaller and competition is intense. That inflates CPMs structurally."
This variability underscores how market dynamics can shift CPLs significantly over time.
YoY Change %
Year-over-year trends reveal contrasting patterns between the two sectors. Finance CPLs rose 24% between January 2025 ($25.94) and January 2026 ($32.03). Meanwhile, legal services saw a 20% decline during the same period, dropping from $85 to $67, despite notable mid-year fluctuations. Both industries, however, experience seasonal cost surges, particularly in Q4, as year-end demand intensifies auction competition, making it necessary to use automated bid rules to control costs.
These trends highlight the importance of carefully managing lead generation tracking strategies and prioritizing ad sets to balance cost and quality.
Key Influencing Factors
Balancing lead volume and quality remains a top challenge in both sectors. Albertas Pocius, Co-founder and CMO of TryCrush.ai, emphasizes the need to shift focus beyond CPL:
"A $50 lead that converts is infinitely cheaper than a $5 lead that doesn't. When analyzing facebook paid ads cost, ignore CPL. Look at CPQL (Cost Per Qualified Lead) and CAC (Customer Acquisition Cost)." To see how your current metrics stack up, you can use an ad performance analyzer to identify optimization opportunities. You can also use AI-driven recommendations to refine your bidding and targeting.
Video ads play a crucial role in improving lead quality, as they engage potential customers by providing detailed information about services. Prospects who watch 15–30 seconds of video content are often more qualified than those who impulsively click on static ads. Additionally, law firms are tailoring their messaging based on practice areas and local markets, helping them maintain conversion rates close to the 10% benchmark projected for 2026.
These strategies are essential for navigating the complexities of lead generation in these competitive industries.
Comparison Table: Pros and Cons
The table below brings together key Cost Per Lead (CPL) benchmarks across eight major industries, making it easier to compare average costs, typical ranges, year-over-year (YoY) changes, and the factors driving these trends, such as AI-driven resource prioritization.
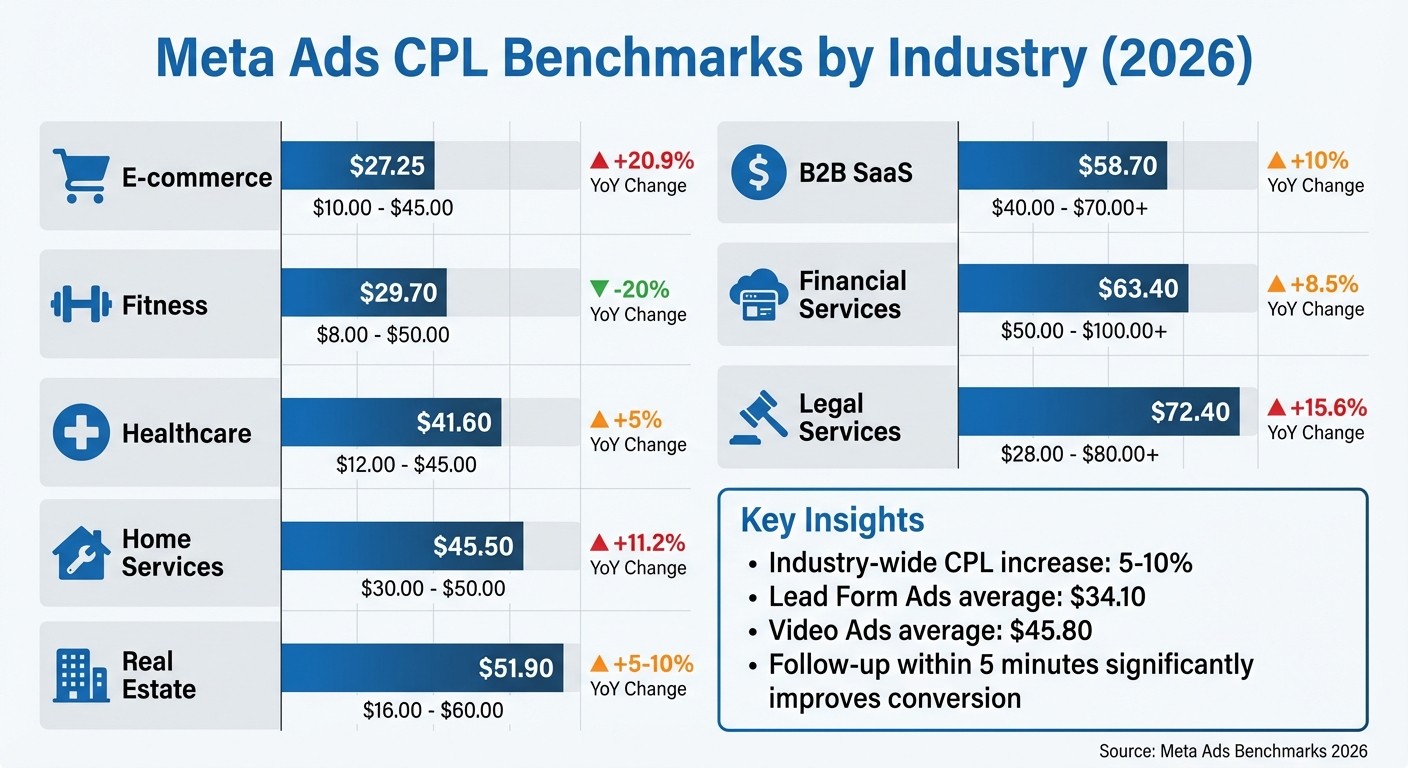
For example, E-commerce stands out with a relatively low average CPL of $27.25. However, it has seen a sharp YoY increase of 20.9%, largely due to ad fatigue and the need for visually engaging content. On the other hand, Legal services have the highest CPL at $72.40, driven by intense competition, high lifetime value (LTV), and trust-building requirements.
Healthcare and Fitness fall in the middle, with average CPLs of $41.60 and $29.70, respectively. While Healthcare saw a modest 5% YoY increase, Fitness experienced a surprising 20% decrease, likely due to seasonal demand shifts and a focus on localized targeting. Meanwhile, B2B SaaS reflects the challenges of long sales cycles and conversion processes like demos and calls, with a higher-than-average CPL of $63.40.
Industry | Avg. CPL (2025/26) | CPL Range (Typical) | YoY Change (Est.) | Key Influencing Factors |
|---|---|---|---|---|
E-commerce | $27.25 | $10.00 - $45.00 | +20.9% | High ad fatigue; visual-heavy creative automation |
Real Estate | $51.90 | $16.00 - $60.00 | +5-10% | High intent; requires offline follow-up |
Home Services | $45.50 | $30.00 - $50.00 | +11.2% | Local competition; seasonal demand |
Healthcare | $41.60 | $12.00 - $45.00 | +5% | High trust barrier; privacy-driven targeting |
Fitness | $29.70 | $8.00 - $50.00 | -20% | Seasonal volatility; local targeting focus |
B2B SaaS | $63.40 | $50.00 - $100.00+ | +8.5% | Long sales cycles; high friction (demos/calls) |
Legal | $72.40 | $28.00 - $80.00+ | +15.6% | High competition; high LTV; trust requirements |
Financial Services | $58.70 | $40.00 - $70.00+ | +10% | Intense auction density; complex regulations |
Industries like Legal and B2B SaaS show the widest CPL ranges, underscoring the variability in niches and targeting strategies. In contrast, Home Services has a narrower range of $30.00 - $50.00, reflecting more predictable costs despite seasonal shifts. This table offers a snapshot of the broader trends and benchmarks explored earlier.
Conclusion
The 2026 Meta Ads CPL benchmarks highlight notable cost differences across industries. For example, E-commerce averages $27.25 per lead, while legal services reach $72.40, with B2B SaaS sitting at $63.40 per lead. Understanding these benchmarks allows you to set realistic budgets and evaluate your campaign’s performance effectively. They also provide a clear picture of industry-specific trends, helping you refine your strategy.
Native Lead Form Ads stand out as a cost-effective option, with an average CPL of $34.10 compared to $45.80 for video ads. These forms simplify the user experience by auto-filling data, which can boost conversion rates by as much as 5×. Additionally, tools like AdAmigo.ai enhance campaign optimization by automatically testing creatives, reallocating budgets to high-performing ads, and pausing those that underperform.
Quick follow-up is crucial - responding within 5 minutes can significantly improve close rates. Keep in mind that it may take 3–6 months to gather enough data, test ad copy and visuals, optimize CTAs, and allow algorithms to identify the most effective audiences before achieving predictable results.
FAQs
What’s a good CPL for my industry in 2026?
A good CPL in 2026 varies depending on your industry, with typical benchmarks falling between $4 and $60. Here's a quick breakdown of average ranges by sector:
E-commerce: $4–$10
Education: $7–$12
Healthcare: $12–$25
B2B services: $20–$50
These figures can help you gauge the performance of your campaigns and ensure they align with industry norms.
Should I optimize for CPL or lead quality?
In 2026, deciding between Cost Per Lead (CPL) and lead quality hinges on your business objectives and industry type. With average CPLs climbing to approximately $27.66, chasing only low CPLs might leave you with leads that don’t convert effectively. Instead, putting emphasis on lead quality - using methods like precise audience targeting and filtering out unqualified prospects - can lead to stronger conversions and improved ROI. This approach is especially effective in high-value sectors like B2B or legal services.
How can I lower CPL without hurting conversions?
To keep your cost per lead (CPL) low while still driving conversions, focus on refining your targeting and ad creative to reach the right audience. One approach is to use broad targeting combined with creative filtering techniques. This can help reduce your cost per thousand impressions (CPMs) while still bringing in high-quality leads.
You can also use conditional logic in Instant Forms to screen out unqualified leads. This ensures your budget is spent on prospects with genuine interest and intent. Another effective strategy is leveraging video ads, which tend to hold viewers’ attention longer. This not only improves engagement but can also enhance lead quality without adding extra costs.
Finally, compare your CPL goals to industry benchmarks to ensure you're on track for a strong return on investment (ROI).