
Meta Ads Benchmarks 2026 by Objective (and Placement)
2026 Meta Ads benchmarks: CTR, CPC, CPM and CPA by objective and placement, plus mobile trends and AI-driven optimization tips.
Meta Ads performance in 2026 has shifted significantly, with key metrics showing both opportunities and challenges for advertisers. Here's what you need to know:
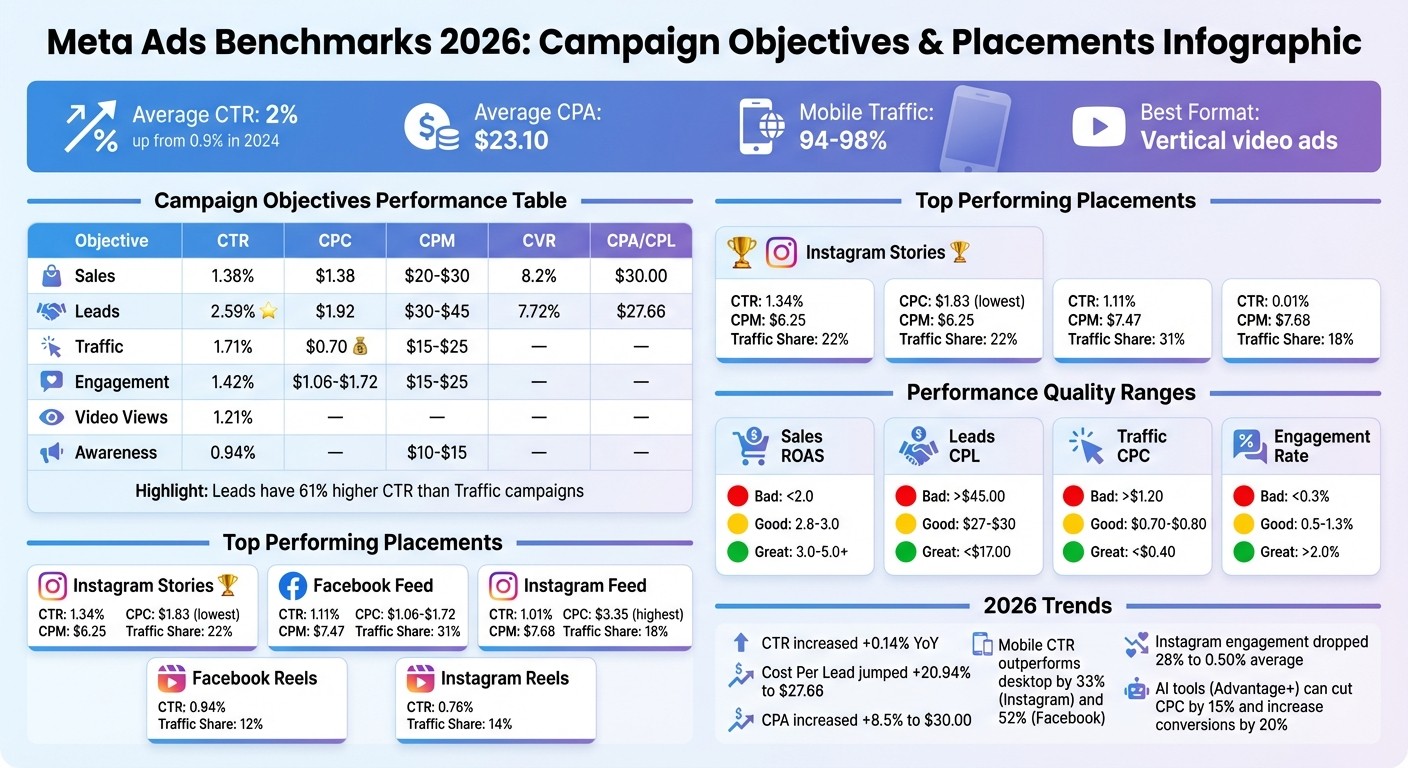
Click-Through Rate (CTR): Average CTR rose to 2%, up from 0.9% in 2024.
Cost Per Acquisition (CPA): Increased to $23.10, reflecting higher competition.
Mobile Dominance: 94–98% of traffic comes from mobile, with vertical video ads performing best.
Placement Insights: Instagram Stories lead with a 1.34% CTR and a low $1.83 CPC, while Instagram Reels and Facebook Reels drive awareness.
Key Campaign Benchmarks by funnel stage:
Sales Campaigns: CTR at 1.38%, $30 CPA.
Lead Generation: Highest CTR at 2.59%, $27.66 CPL.
Traffic Campaigns: Most cost-effective with $0.70 CPC.
Engagement Campaigns: CTR of 1.42%, CPC ranges from $1.06–$1.72.
Placement Highlights:
Instagram Stories: High engagement, lowest CPC ($1.83).
Facebook Feed: Balanced performance with a 1.11% CTR.
Instagram Feed: Higher purchase intent but more expensive ($3.35 CPC).
AI-driven tools like Meta Advantage+ and manual placements and Conversion API are reshaping ad performance, improving targeting and creative optimization while increasing costs. Use these benchmarks to refine your campaigns and align placements with your objectives for better results in 2026. For those looking to grow, understanding ROAS benchmarks is essential for effective scaling.
Meta Ads 2026 Benchmarks by Campaign Objective and Placement
I Studied 12,000 Facebook Ad Accounts - Here's What Works in 2026
Meta Ads Benchmarks by Objective (2026)
Here's the latest cross-industry data (as of January 2026) for Meta's six primary campaign objectives:
Objective | CTR (Link) | CPC | CPM | CVR | CPA/CPL |
|---|---|---|---|---|---|
Sales | 1.38% | $1.38 | $20–$30 | 8.2% | $30.00 |
Leads | 2.59% | $1.92 | $30–$45 | 7.72% | $27.66 |
Traffic | 1.71% | $0.70 | $15–$25 | - | - |
Engagement | 1.42% | $1.06–$1.72 | $15–$25 | - | - |
Video Views | 1.21% | - | - | - | - |
Awareness | 0.94% | - | $10–$15 | - | - |
Lead Generation campaigns stand out with a 2.59% CTR - 61% higher than Traffic campaigns - making them an excellent choice for capturing high-intent prospects. Meanwhile, Traffic campaigns remain the most cost-effective, offering a $0.70 CPC. Sales campaigns strike a balance between reach and conversion, with a CPM of $20–$30 and a 2.79 return on ad spend (ROAS).
Metric Definitions
CTR (Click-Through Rate): Measures how often people click on your ad after seeing it, providing insight into audience engagement.
CPC (Cost Per Click): Reflects the cost efficiency of driving traffic to your site.
CPM (Cost Per Mille): Represents the cost to display your ad 1,000 times, often influenced by auction competition.
CVR (Conversion Rate): Indicates the percentage of users who complete a desired action after clicking your ad.
CPA/CPL (Cost Per Action/Lead): Divides total spend by the number of successful actions, helping evaluate acquisition costs.
These metrics form the foundation for understanding the performance trends outlined below. For context, you can also compare these figures against industry-specific benchmarks from previous years.
2026 Performance Trends
In 2026, conversion-focused campaigns showed a slight improvement, with CTR increasing by 0.14% year-over-year. On the other hand, Reach campaigns saw a small decline of 0.02%, as Meta's algorithms continue to prioritize engagement over broad visibility. Enhanced AI targeting has been a major factor in these shifts. However, rising competition has driven costs upward: Cost Per Lead jumped by 20.94% to $27.66, while CPA reached $30.00, an 8.5% increase from 2025.
Mobile devices dominate traffic, accounting for 94–98% of activity, and significantly outperform desktop CTRs - by 33% on Instagram and 52% on Facebook. Despite this, Instagram's overall engagement rates dropped by 28% to an average of 0.50%, though Reels continue to deliver stronger interaction rates. Creative formats play a crucial role in performance, with video and carousel ads driving higher CTRs and more efficient acquisitions compared to single-image ads.
Benchmarks by Placement
Performance on Meta’s platforms can vary widely depending on where your ads appear. For instance, Instagram Stories dominate with a 1.34% CTR, which is 61% higher than the Facebook Feed, while also offering the lowest CPC at lowest CPC at $1.83.83. On the other hand, Instagram Feed ads come with a higher CPC of $3.35 but make up for it with strong purchase intent. Meanwhile, Reels are a cost-efficient option for generating broad awareness.
Placement | CTR | CPC | CPM | Traffic Share |
|---|---|---|---|---|
Instagram Stories | 1.34% | $1.83 | $6.25 | 22% |
Facebook Feed | 1.11% | $1.06–$1.72 | $7.47 | 31% |
Instagram Feed | 1.01% | $3.35 | $7.68 | 18% |
Facebook Reels | 0.94% | - | - | 12% |
Instagram Reels | 0.76% | - | - | 14% |
These metrics underline the unique strengths of each placement, which can be leveraged depending on your campaign goals.
How Each Placement Performs
Instagram Stories are perfect for driving immediate action. Their full-screen design makes them immersive, while their $1.83 CPC is nearly 45% cheaper than Instagram Feed ads. With a $6.25 CPM, Stories also provide the most affordable impressions.
"Story ads clicks are cheaper because they're full-screen and more immersive. A CPC below $2.00, especially in Stories, indicates efficient audience targeting and strong creative resonance." - Lornah Ngugi, WebFX
Facebook Feed ads provide a reliable balance between engagement and conversions, making them a solid choice for general campaigns , especially when compared against CTR benchmarks by industry. Meanwhile, Instagram Feed ads attract users with a higher purchase intent, making them ideal for visually-driven products and brand discovery.
Reels are a go-to for creating broad awareness. Since mobile accounts for 94% to 98% of all traffic, and mobile CTRs outperform desktop by 33% on Instagram and 52% on Facebook, Reels are well-suited for reaching larger audiences.
Selecting Placements for Your Campaign
To maximize results, align your ad placements with your campaign’s objectives. If you’re running a time-sensitive promotion or need a quick call-to-action, Instagram Stories are your best bet due to their high engagement and low CPC. For campaigns focused on volume and steady performance, Facebook Feed is a reliable choice. If your goal is to expand awareness or test creative formats, Reels provide an efficient solution. Lastly, for conversion-driven campaigns - especially those showcasing visual products - Instagram Feed can justify its higher cost with its strong purchase intent.
Make sure your creative assets are tailored for vertical viewing using a Creative Format Converter, as nearly all engagement comes from mobile users. If you’re using Meta’s Advantage+ automatic placements, keep a close eye on performance. Using an Ad Performance Analyzer can help you track these shifts in real-time. Although these tools can cut CPC by 15% and increase conversions by 20%, careful monitoring is necessary to avoid wasting budget on low-intent placements. By pairing AI-powered tools with these benchmarks, you can fine-tune your campaign strategy for better results.
Performance Ranges by Objective
How to Use Performance Ranges
Benchmarks are essential for spotting performance gaps in your campaigns. For example, a "Bad" performance (bottom 25%) might signal issues like poor targeting, worn-out creatives, or friction on your landing page. On the other hand, "Good" performance represents the median, while "Great" performance (top 25%) indicates strong audience alignment and an efficient funnel. These benchmarks help zero in on areas that need improvement, guiding you toward smarter campaign tweaks.
"The goal with benchmarks isn't to hit an exact number. It's to identify what's working, what's wasting budget, and where strategic testing can close the gap." - Lornah Ngugi, Marketing Writer, WebFX
For instance, if your click-through rate (CTR) is under 0.72%, it’s likely your audience isn’t connecting with your creative. This might mean it’s time to refine your ad copy or visuals or tighten your targeting. Similarly, a conversion rate (CVR) below 2% could point to landing page issues or an offer that doesn't resonate. And if your ad frequency goes beyond 3.0, brace yourself for a 10–25% increase in cost per acquisition (CPA) due to ad fatigue.
The table below lays out performance benchmarks for various campaign objectives.
Ranges for Each Objective
Objective | Metric | Bad (Below Avg) | Good (Average) | Great (Top Tier) |
|---|---|---|---|---|
Sales | ROAS | < 2.0 | 2.8–3.0 | 3.0–5.0+ |
Sales | CVR | < 2.0% | 8.2%–9.2% | 12%–14%+ |
Leads | CPL | > $45.00 | $27.00–$30.00 | < $17.00 |
Leads | CTR | < 1.0% | 2.5%–2.6% | > 3.5% |
Traffic | CPC | > $1.20 | $0.70–$0.80 | < $0.40 |
Traffic | CTR | < 0.8% | 1.5%–1.7% | > 2.7% |
Engagement | Eng. Rate | < 0.3% | 0.5%–1.3% | > 2.0% |
Video Views | VVR | < 10% | 15%–29% | > 30% |
App Promotion | CPA | > $60.00 | $35.00–$55.00 | < $30.00 |
It’s worth noting that CTR benchmarks can vary widely by industry. For example, sectors like Shopping/Gifts often achieve rates as high as 4.13%, while Finance tends to hover below 1%. Industries that rely heavily on visuals usually see better engagement, while B2B and professional services often experience lower CTRs. These benchmarks are a solid starting point, but you’ll need to tailor them to your specific industry and campaign goals. For a deeper dive, see our benchmarks by industry and country.
What's Driving 2026 Benchmarks
AI and Automation Effects
Meta's AI-powered tools are reshaping campaign performance, delivering more precise audience targeting and better creative optimization. For instance, these advancements have led to a +0.14% year-over-year improvement in CTR, while also identifying high-value users in industries like construction and home services. These AI-driven adjustments are directly influencing key metrics like CTR and CPC, aligning with the benchmark trends.
One standout feature, Advantage+, automates bidding and adjusts spending dynamically across audiences and placements. Dynamic creative optimization takes it further by testing multiple combinations of headlines, visuals, and copy to find the best performers, which the AI quickly scales. However, this increased automation comes with a cost: while the average CVR is expected to rise from 7.72% to 8.2% (+6.2%), the average CPC has also climbed from $0.70 to $0.78 (+11.4%).
Another critical tool is the Conversion API (CAPI), which has become indispensable as browser-side tracking becomes less reliable. By using CAPI, advertisers can send key first-party data - like bookings and phone calls - directly to Meta, enabling the AI to optimize for revenue-driving actions rather than just clicks. These advancements are not only refining targeting but also influencing ad formats and placements.
Format and Placement Shifts
Meta's AI improvements are also reshaping creative formats and placements. For example, Instagram Stories are delivering 61% higher CTRs compared to the Facebook Feed, even though they generate less overall traffic. This trend highlights the growing importance of creating scroll-stopping content rather than relying on traditional polished ads. With mobile devices continuing to dominate platform traffic, mobile-first optimization remains non-negotiable.
In January 2026, Instagram Explore merged with Reels, funneling users from Explore tiles into an immersive Reels experience. This move reflects Meta's focus on vertical video formats, which are known to drive higher engagement. These changes align with the broader improvements in campaign efficiency. Creative performance now plays a major role in controlling CPM: high-performing creatives with conversion rates above 10–15% can keep CPMs around $25, while weaker creatives can see CPMs spike to over $50.
AI Tools for Meta Ads Optimization
Why Use AI Tools
Managing Meta Ads manually just doesn’t cut it anymore. Meta's Andromeda algorithm has changed the game, focusing on creative diversity and audience matching at speeds that are hard to keep up with. Instead of minor tweaks to hooks, the algorithm leans toward a variety of creative styles - like favoring lo-fi, user-generated content over polished, cinematic brand ads. As one expert put it: "AI isn't replacing creative teams. It's giving them x-ray vision."
AI tools step in to handle tasks that would otherwise be overwhelming. They monitor key performance metrics to avoid creative fatigue, manage consolidated campaign structures (like broad Sales CBOs) to ensure AI models have enough data to work with, and automatically adjust creatives to fit different placements. This keeps CPMs efficient, especially with most inventory now leaning toward vertical formats. The result? A system that automates the heavy lifting, paving the way for smarter, more integrated campaign management.
AdAmigo.ai Features and Pricing
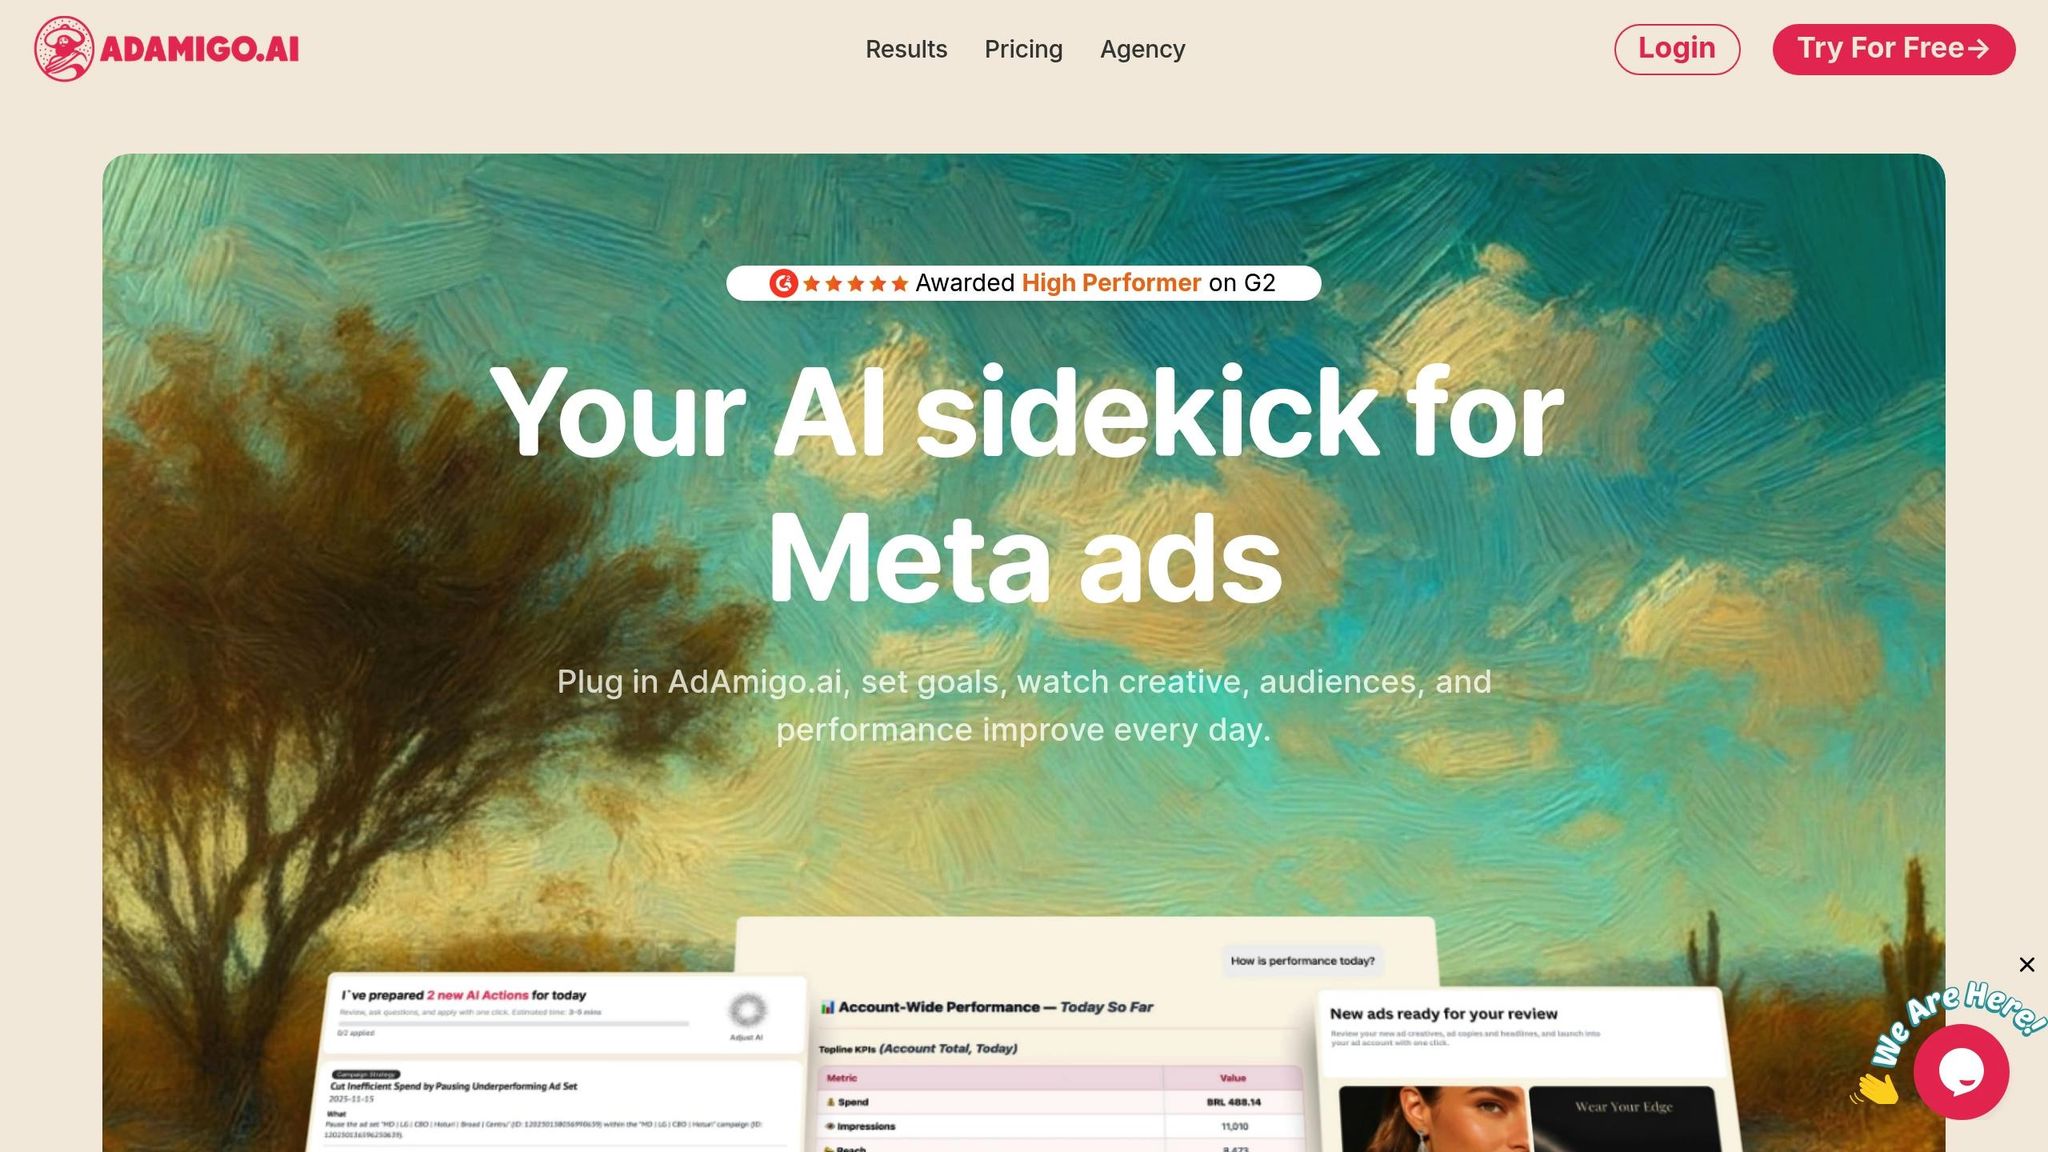
AdAmigo.ai takes these AI advancements a step further, acting as a hands-off media buyer for Meta Ads. It simplifies campaign management so you can focus on the bigger picture. Its AI Ads Agent can create on-brand, conversion-focused creatives in just one click, while the AI Actions feature provides a daily, auto-prioritized to-do list. These tasks include everything from launching new campaigns and adjusting audiences to reallocating budgets and fine-tuning bids - explained in straightforward language, no guesswork required.
AdAmigo.ai offers two main pricing plans:
Entry Plan: At $99/month (or $79/month when billed annually), this plan includes up to 2 AI Actions per day, unlimited ad account audits, full chat agent access, and detailed dashboards. It’s a great fit for accounts spending under $5,000/month.
Gringo Plan: Priced at $299/month (or $179/month billed annually), this plan unlocks unlimited AI Actions, bulk ad launching from Google Drive, Slack/WhatsApp integration, and a one-on-one onboarding session with a Meta ads expert.
Both plans are designed to optimize every aspect of your campaigns - creatives, targeting, bids, and budgets - while respecting your rules for budget pacing, placement, and geography. It’s all about running your campaigns as a cohesive system, not just a collection of isolated tasks.
Conclusion
Meta Ads benchmarks aren't just stats - they're a roadmap for making smarter campaign decisions. By analyzing metrics like CTR, CPC, CPM, and CPA across campaign objectives such as Sales, Leads, and Traffic, you can set achievable goals and pinpoint areas where your campaigns might need improvement.
Your placement strategy also holds a lot of power. Allocating your budget wisely by optimizing Meta ad placements like Feed, Reels, or Stories can help reduce CPM and make your ad spend go further.
Using an ad performance benchmark tool offers a quick snapshot of how your campaigns stack up, showing whether you're on track or need to make adjustments.
AI has transformed the way Meta Ads campaigns are managed. Instead of relying solely on manual tweaks, AI can fine-tune targeting, budgets, and creatives in real-time. It doesn’t replace strategy - it enhances it, handling repetitive tasks so you can focus on the bigger picture.
Together, benchmarks, placement strategies, performance ranges, and Full-funnel AI optimization creates a strong framework for improving campaign performance. Use the insights from this guide as a launchpad, experiment thoughtfully, and refine your approach to achieve even better results in 2026.
Last Updated
Revalidated on January 29, 2026
This guide's benchmarks are based on data gathered from January 15 to December 30, 2025, spanning 16 industries. To identify performance trends, active campaign data from Q1–Q3 2025 was compared with 2024 benchmarks.
The benchmarks are updated quarterly to reflect the latest Meta Ads trends, seasonal changes, and algorithm adjustments. Factors like platform updates, privacy policies, such as iOS privacy changes, and inflation continue to influence ad costs and engagement rates. These regular updates ensure the data stays relevant and actionable.
"Benchmarks are not static. They change in response to consumer trends, seasonal fluctuations, and advertising competition." - Lornah Ngugi, Marketing Writer
Quarterly reviews highlight competitive opportunities and guide necessary campaign tweaks. This ongoing refresh helps advertisers adapt quickly to shifting trends. Keep in mind, these benchmarks are a starting point for optimization, not fixed targets, as results can differ widely depending on industry and campaign goals. Use them to fine-tune your strategies and stay ahead.
FAQs
How can advertisers use AI to optimize their Meta Ads campaigns in 2026?
In 2026, advertisers have access to AI-powered tools that make running Meta Ads campaigns smarter and more efficient. Tools like Meta’s Advantage+ and various third-party platforms take care of time-consuming tasks like real-time bid adjustments, pinpointing target audiences, and scaling campaigns effortlessly. AI also plays a key role in generating a variety of ad creatives, aligning with Meta’s push for creative diversity to improve algorithmic performance.
These tools also shine when it comes to analytics. Advertisers can track important metrics - like CTR (click-through rate), CPC (cost per click), and CPM (cost per thousand impressions) - in real time. This means campaigns can be fine-tuned on the fly. By pinpointing the best-performing placements and audience segments, AI tools help advertisers get the most bang for their buck. As Meta’s algorithms continue to favor dynamic testing and creative variety, these tools are becoming a must-have for anyone aiming to stay ahead and achieve scalable growth.
How do Instagram Stories and Facebook Feed placements compare in performance?
Instagram Stories and Facebook Feed placements bring distinct advantages when it comes to engagement and cost. Stories often shine with higher click-through rates (CTR) thanks to their immersive, full-screen format that grabs attention quickly. But this engaging experience often comes at a price, with higher costs per click (CPC) and costs per thousand impressions (CPM) compared to Feed placements.
Facebook Feed placements, meanwhile, offer a broader reach and tend to be more budget-friendly, delivering lower CPC and CPM. This makes them a great choice for campaigns aiming to drive traffic or build awareness without breaking the bank. While Stories are perfect for boosting brand engagement, Feed placements work best for large-scale, cost-effective campaigns.
Why is the Cost Per Acquisition (CPA) higher in 2026, and how can advertisers reduce it?
The increase in Cost Per Acquisition (CPA) in 2026 comes down to a mix of factors. For starters, key metrics like Cost Per Click (CPC) and Cost Per Mille (CPM) have climbed, making each interaction more expensive. On top of that, ad bidding has grown more competitive, and platform algorithms continue to evolve, often raising the bar for effective campaigns. Add in changes in user behavior and the sheer volume of ads audiences are exposed to, and it’s no wonder converting potential customers is harder - and costlier - than before.
How to Keep CPA Under Control
If you're looking to manage CPA, the key is optimizing every part of your campaign. Here are a few ways to do that:
Refine audience targeting: Zero in on the right people to ensure your ads reach those most likely to convert.
Test creative assets: Experiment with different visuals, copy, and formats to find what resonates best.
Focus on high-performing placements: Platforms like Feeds and Stories often deliver better results, so prioritize these spaces.
Analyze performance data regularly: Use insights to tweak bids, budgets, and strategies as needed.
Prioritize ROI-driven objectives: Concentrate on goals like leads or sales, which directly impact your bottom line.
By staying proactive and strategic, you can navigate rising costs while still achieving meaningful results.