
Average Meta Ads Conversion Rate by Industry (2026 Data)
Average Meta Ads conversion rate: 9.21% in 2026. Industry benchmarks span 14.29% (Fitness) to 0.37% (Hardware). What's a good CVR for your vertical in 2026?
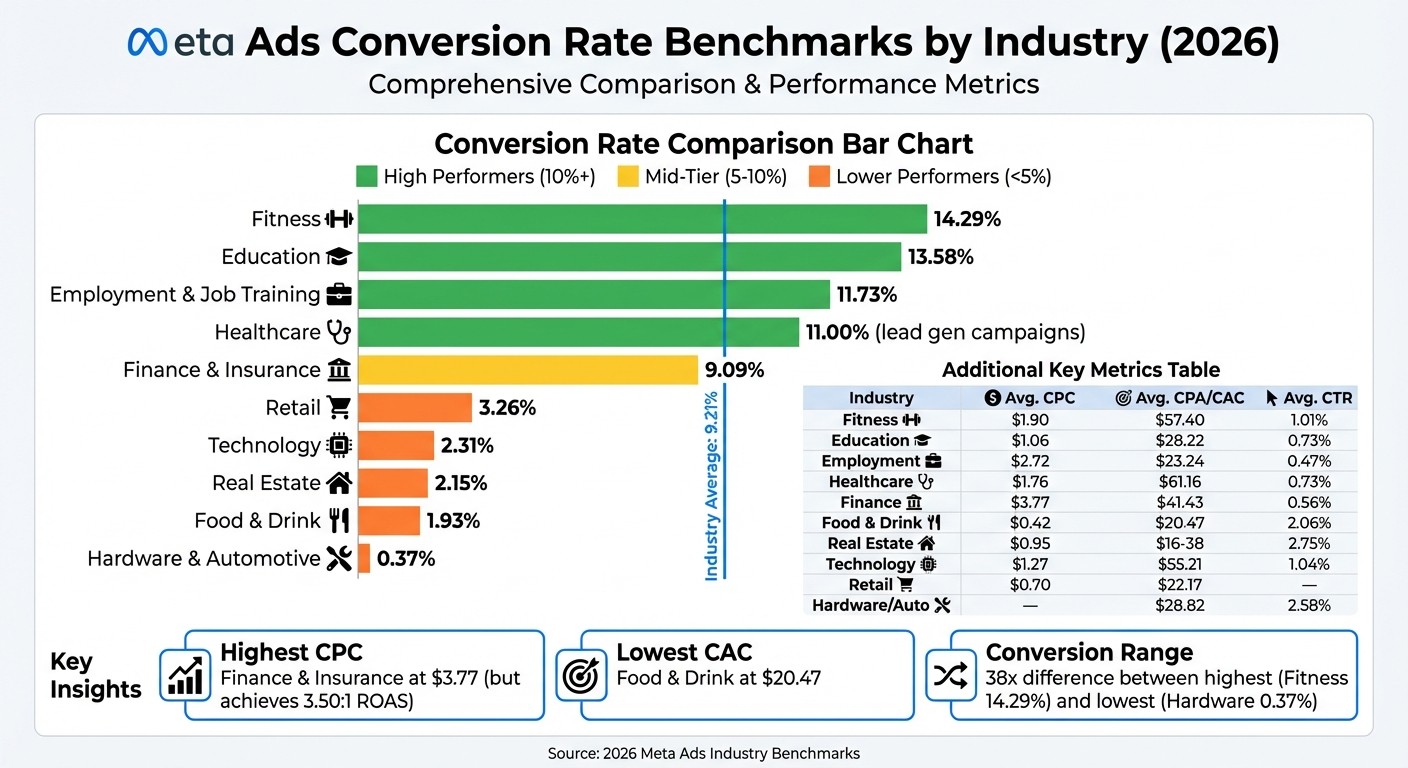
The average Meta Ads conversion rate across all industries is 9.21% in 2026. That's the headline number — but it's only half the story. Conversion rates range from 14.29% in Fitness to just 0.37% in Hardware and Automotive, and where your campaigns land on that spectrum depends heavily on your industry, your offer, and — critically — how well your tracking is set up.
Here's the quick-reference framework to gauge your performance:
Above 10% — You're in elite territory. Fitness, Education, and Healthcare lead campaigns routinely hit this range.
5–10% — Solid, competitive performance. Finance, Legal, and Employment typically live here.
3–5% — Room to improve. Retail, Apparel, and mid-tier sectors often fall into this band.
Below 3% — Needs work. Technology, Hardware, and high-consideration purchases face structural headwinds, but optimization can still move the needle.
One important nuance: the 9.21% average comes from WordStream's industry survey data, but Triple Whale's analysis of 35,000+ ad accounts shows a median CVR of just 1.46% — a reminder that "averages" are pulled up by top performers and that your own account's median may look very different. Both numbers matter: use the industry average to set aspirational targets, and your actual median to ground your week-to-week optimization.
How conversion rate is calculated: CVR = (Conversions ÷ Clicks) × 100. A campaign that generates 50 purchases from 1,000 link clicks has a 5% conversion rate. Simple — but only as accurate as the conversion data feeding it. With iOS privacy changes causing 20–30% data loss, pairing your Meta Pixel with Conversions API (CAPI) isn't optional anymore — your reported CVR is only as trustworthy as your tracking setup.
Below, we break down conversion rates, cost benchmarks, and optimization tactics for all 10 major industries — backed by 2026 data from WordStream, Triple Whale, and on-platform Meta insights. Use these benchmarks to spot gaps in your funnel and set realistic targets, not as rigid standards.
Meta Ads Conversion Rates by Industry 2026 Benchmarks
1. Fitness
Average Conversion Rate (%)
The fitness industry stands out with an impressive 14.29% conversion rate. This strong performance ties directly to the urgency of consumer intent in this space. However, the cost per lead (CPL) at $57.40 and cost per purchase (CPP) at $143 are significantly higher than the averages across industries.
Key Drivers
For gym membership campaigns, narrowing your focus to a 5–8 mile radius is essential. Timing is equally critical - leads contacted within 5 minutes are nine times more likely to convert compared to those contacted after an hour. This highlights the need for an efficient full-funnel follow-up system.
Low-barrier offers are another key factor in driving conversions. Deals like free week passes, $1 first-month trials, or complimentary personal training sessions make it easier for potential customers to take the first step. When it comes to lead generation, Meta's instant lead forms - which only require basic details like name, email, and phone - tend to outperform traffic campaigns for local fitness businesses.
For fitness apps and supplements, user-generated content (UGC) can increase conversion rates by up to 300%. Raw, authentic footage - think mid-workout clips - tends to connect better with audiences than polished, studio-quality content.
These strategies create a solid foundation for addressing seasonal and subscription-based trends that shape the fitness market.
Trends and Insights
Seasonality plays a big role in fitness marketing. Conversion rates spike by 40–60% in January, driven by New Year's resolutions, with a smaller surge in May and June. Costs, however, fluctuate - CPP peaks in July but drops to its lowest levels in November. To stay ahead, advertisers often launch "New Year" campaigns in mid-December, avoiding the 20–30% CPM increase that hits in January.
Subscription-based models are becoming more prominent in the fitness space, particularly for apps and supplements. These models enhance lifetime value (LTV), making higher upfront acquisition costs more justifiable. For example, protein powder subscriptions deliver 2.5–4× first-purchase ROAS with 40–60% repeat rates, while subscription boxes yield 1.5–2.5× ROAS and retain 60–80% of customers.
Optimization Opportunities
A mobile-first approach is crucial, as 94–98% of traffic comes from mobile devices, which also outperform desktop click-through rates (CTR) by 33–52%. Short-form vertical videos, like Reels, align perfectly with how users naturally consume content and are highly effective.
Consider using 30-second video tours of your facilities to establish trust. Retargeting efforts can also benefit from segmentation based on user intent. For example:
1–7 days for cart abandoners
1–14 days for product viewers
30–180 days for past customers
This approach can significantly boost reorders. Additionally, integrating both Meta Pixel and Conversions API (CAPI) helps combat the 20–30% data loss caused by iOS privacy changes.
Lastly, compliance matters. Avoid making claims about guaranteed weight loss and instead focus on promoting ingredient quality, third-party testing, and general lifestyle benefits. Including disclaimers like "results may vary" on transformation-related content can also help prevent ad rejections.
2. Education
Average Conversion Rate (%)
The education industry sees an average conversion rate of 3.10%. This is higher than industries like retail (1.95%), fitness (2.19%), and technology (2.03%) but falls short of high-intent sectors such as finance (4.87%) and legal (4.64%). For lead generation campaigns specifically, education campaigns perform even better with an average conversion rate of 10.08%, reflecting a 24% year-over-year increase.
Meta Ads provide a cost-effective option for education advertisers. The average cost per lead on Meta is $28.22, significantly lower than Google Ads, where the average cost per lead is $90.02. Additional metrics include an average cost per click of $1.06, a click-through rate of 0.73%, and a CPM of $7.74.
"The average Education advertiser can expect to cough up just over $90 for each conversion on the Google search network. For each Facebook conversion, however, the average cost is under $29!"
Susie Marino, Senior Content Marketing Specialist, WordStream
These cost advantages highlight key opportunities for education advertisers to optimize their performance.
Key Drivers
One major factor driving success in education campaigns is the use of on-platform lead forms. These forms allow students to request information directly on platforms like Facebook or Instagram, removing the need to navigate to external landing pages. This seamless experience contributes to the 10.08% conversion rate in lead campaigns.
Retargeting also proves highly effective. By focusing on website visitors and students who start but don't finish applications, advertisers can achieve performance gains of 367% compared to targeting cold audiences. Given that over 70% of students abandon their applications midway, simplifying forms and reducing the number of required fields can significantly improve completion rates. Additionally, lookalike audiences outperform interest-based targeting by 35%, making them a valuable tool in this sector.
Trends and Insights
Shifts in student behavior are influencing campaign strategies. While 62% of education site traffic comes from mobile devices, most students still prefer completing full applications on desktops. Platforms like TikTok and Instagram are essential for engaging Gen Z, with TikTok showing engagement rates of 5.40% and Instagram at 3.15%.
"The playbook that worked in 2023 won't cut it in 2026. Students discover programs on their phones but complete applications on desktops."
Hadis Mohtasham, Marketing Manager, CUFinder
Looking ahead, rising competition in ad auctions is expected to increase the cost per lead by 5–10% as we approach 2026. However, advancements like Meta's Advantage+ and AI-driven bidding are projected to improve overall conversion rates by 6.2% across the platform.
Optimization Opportunities
Education advertisers can improve their performance further by integrating Meta's Conversions API (CAPI) with the Pixel. This setup helps recover data lost due to ad blockers and privacy updates, ensuring more accurate conversion tracking. Timing campaigns around enrollment deadlines can also capture high-intent traffic when prospective students are actively making decisions.
Segmenting campaigns by specific program types or degree levels instead of using broad institutional messaging can enhance targeting precision. Offering lead magnets such as scholarship calculators or program guides can increase landing page conversion rates to as high as 14.2%. Testing creative formats like video and carousel ads, alongside single images, often results in higher click-through rates and more efficient acquisitions.
3. Employment and Job Training
Average Conversion Rate (%)
The employment and job training sector stands out with an 11.73% conversion rate on Meta Ads - well above the 9.21% cross-industry average. Despite a relatively low click-through rate (CTR) of 0.47%, the clicks it does generate are highly intent-driven, making them more valuable.
On average, this industry sees a cost per click (CPC) of $2.72 and a cost per acquisition (CPA) of $23.24. When it comes to lead-focused campaigns, Meta shines with a median CPC of $1.92, which is nearly 60% cheaper than Google Ads' average CPC of $5.26. Lead generation campaigns on Meta also achieve a 2.59% CTR and an average cost per lead of $27.66.
Industry | Average CTR | Average CPC | Average CVR | Average CPA |
|---|---|---|---|---|
Employment & Job Training | 0.47% | $2.72 | 11.73% | $23.24 |
Education | 0.73% | $1.06 | 13.58% | $7.85 |
Fitness | 1.01% | $1.90 | 14.29% | $13.29 |
B2B | 0.78% | $2.52 | 10.63% | $23.77 |
Technology | 1.04% | $1.27 | 2.31% | $55.21 |
All Industry Average | 0.90% | $1.72 | 9.21% | $18.68 |
(Source: WordStream Industry Benchmarks)
Key Drivers
Meta's Lead Generation ads are a game-changer for this sector. These ads let users submit their details directly on the platform using autofill, which reduces friction and makes the process seamless. Since employment services often address urgent needs, job seekers are more likely to engage with ads that speak directly to their challenges and aspirations. Ads with specific, targeted messaging consistently outperform generic ones.
Trends and Insights
Creative content plays a massive role in campaign success - accounting for 70–80% of the results, far outweighing budget or targeting considerations. Authentic, user-generated content, such as testimonials or real-life career success stories, can increase conversion rates by up to 300% compared to polished corporate ads.
"Job Seekers: Often super engaged. If you're offering tools or training, expect a strong response - especially if your message speaks to their current struggles."
Zain Zia, Author
Another growing trend is campaign consolidation. Advertisers are moving away from highly segmented ad structures in favor of broader campaigns. This approach allows Meta's algorithms to optimize performance more effectively.
Optimization Opportunities
Using user-generated content to build trust can make a huge difference when targeting job seekers. Simplifying campaign structures - by merging multiple ad sets into one broad campaign - can help Meta's AI learn faster and improve overall performance.
Additionally, native lead forms on Meta vs. website-based forms are both viable, but the former is often more cost-effective while the latter attracts higher-intent leads, even if they come at a higher cost. Testing both formats can help determine which delivers better results. For top-of-funnel awareness, choosing traffic-focused campaign objectives is a smart option, boasting a 1.71% CTR and an average CPC of just $0.70.
These strategies and insights provide valuable benchmarks to compare performance across industries. For a broader perspective, you can also review Meta Ads benchmarks by industry and country to see how global trends impact these figures.
4. Healthcare
Average Conversion Rate (%)
Healthcare marketing on Meta comes with its own set of hurdles, requiring a clear understanding of industry benchmarks. The median conversion rate for healthcare ads is 2.84%, which falls short compared to the 9.21% average across all industries. Campaign performance varies significantly by type, with lead generation campaigns achieving 7.72%–8.80% conversion rates. Specific segments show differing results: dentists and dental services manage 6.38%, while physicians and surgeons see 4.51%.
Engagement remains a challenge, with click-through rates (CTR) hovering between 0.73% and 0.9%, ranking healthcare among the lowest-performing sectors in this area. On the bright side, the average cost per click (CPC) is $1.76, but the cost per acquisition (CPA) is notably higher at $61.16. A concerning trend is the 70% year-over-year increase in CPMs, which rose from $22.76 in January 2025 to $38.70 in January 2026.
Healthcare Segment | Average CVR | Average CPC | Average CPL/CPA |
|---|---|---|---|
Healthcare (General) | 2.84% | $1.76 | $61.16 |
Lead Generation Campaigns | 7.72%–8.80% | $1.90–$2.10 | $27.66–$30.00 |
Physicians & Surgeons | 4.51% | $1.32 | $47.47 |
Dentists & Dental Services | 6.38% | - | $76.71 |
All Industry Average | 9.21% | $1.72 | $18.68 |
Sources:
Key Drivers
In healthcare, decisions are often guided by trust and empathy rather than technical expertise. For instance, 65% of patients opt for telehealth due to its convenience, emphasizing the importance of messaging around "access" and "privacy". The dominance of mobile traffic in this sector is striking, accounting for 94%–98% of activity on Meta.
Lead ads play a crucial role in streamlining the user experience, enabling patients to share their information directly on the platform. This format can boost conversion rates by up to 300% compared to traffic-focused campaigns. Including qualifying questions in lead forms further refines audience targeting, helping Meta's algorithm identify patients with higher intent.
Trends and Insights
November 2025 marked a major shift as Meta rolled out a 3-tier restriction system for health advertisers. Tier 3 categories - covering areas like mental health, addiction treatment, and reproductive care - now face stringent rules on audience targeting and conversion optimization. Adding to the complexity, the FDA issued 30 warning letters in March 2026 to substance use treatment providers, signaling increased scrutiny of health-related ad content.
To adapt, advertisers are leaning into compliance-first creative strategies, focusing on educational and benefit-driven messaging to avoid ad rejections for health claims rather than diagnosis-specific content. Many are also adopting Meta's Conversions API (CAPI) and tracking pixels alongside HIPAA-compliant tools to address challenges with browser-side tracking. Additionally, short-form video content, such as Reels and Stories, is gaining traction as a "trust-builder." Video engagement campaigns, for example, achieve a 15.31% conversion rate, a 71% improvement over standard traffic campaigns.
These developments highlight the growing need for tailored strategies in healthcare advertising.
Optimization Opportunities
Healthcare advertisers can achieve better results by focusing on targeted optimizations. For example, running campaigns tailored to specific services - like "dermatology consult" instead of a broad "dermatology" - can boost relevance and improve CTRs. For high-consideration services, such as specialized surgeries, retargeting is essential. Retargeting campaigns can deliver conversion rates as high as 15.8%, as patients often need multiple interactions before booking an appointment.
Quick follow-ups on leads can also enhance appointment rates and profitability. Video ads that immediately highlight the provider, service, and a clear call to action are particularly effective. Instagram Stories, for instance, achieve 61% higher CTRs than Facebook Feed ads, making them a valuable tool for driving engagement. By leveraging these data-driven tactics, healthcare advertisers can better align their efforts with industry benchmarks and improve campaign performance.
5. Food and Drink
Average Conversion Rate (%)
The food and drink industry stands out as one of the top performers on Meta platforms in 2026, thanks to its visually appealing content and impulse-driven purchases. Reports show an average conversion rate between 1.54% and 1.93%, which is the highest among all analyzed industries. To put this into perspective, sectors like hardware and automotive hover around 0.37%, while art and home decor average about 0.61%.
What makes this sector even more appealing is its low customer acquisition cost (CAC) of $20.47 and an average cost per click (CPC) of just $0.42 (use a CPC estimator to project your own costs), a stark contrast to the B2B average of $2.52. The click-through rate (CTR) is also strong at 2.06%, with a cost per thousand impressions (CPM) of $8.21. For lead generation campaigns, conversion rates can climb as high as 5.63%.
Metric | Food & Drink Benchmark |
|---|---|
Average Conversion Rate | 1.54% – 1.93% (Highest across industries) |
Average CAC | $20.47 (Lowest across industries) |
Average CPC | $0.42 (Highly cost-effective) |
Average CTR | 2.06% (Above average engagement) |
Average CPM | $8.21 (Moderate auction pressure) |
Key Drivers
In this space, visual content reigns supreme. With 74.5% of all website visits coming from mobile devices, optimizing creative for mobile is essential. In fact, creative quality is responsible for 70–80% of ad performance, often outweighing the impact of complex targeting strategies. High purchase intent and frequent repeat purchases also contribute significantly to the impressive conversion rates.
For example, Choosing the best Meta ad placements is crucial; for instance, Instagram Stories outperform Facebook Feed ads for food-related content, delivering 61% higher click-through rates. However, challenges like cart abandonment - hovering at around 68% - persist. Despite this, leading food brands achieve e-commerce conversion rates of up to 5.8%, well above the industry average of 3.4%.
Emerging trends continue to shape success in this sector, opening up new opportunities for marketers.
Trends and Insights
Short-form video content, such as Reels and Stories, has become a must-have in 2026 for grabbing attention in fast-paced, scroll-heavy environments. Consumers are also increasingly drawn to brands that highlight ethical sourcing and environmental responsibility. Recipe-based content remains a favorite, as many users turn to their mobile devices for meal inspiration.
A great example of this is Back to the Roots, which ran conversion-focused campaigns during the 2024 holiday season on Facebook and Instagram. By leveraging customer data and offering strategic discounts, they achieved an impressive 146% ROI. This demonstrates how personalized targeting and timely promotions can deliver outstanding results.
Optimization Opportunities
Dynamic Product Ads (DPA) are a powerful tool for addressing the 68% of users who abandon their carts, as they showcase the exact items users viewed. To combat ad fatigue - a common issue in visually driven industries - marketers should frequently rotate and scale creatives to maintain engagement and keep costs low. Optimizing ad formats for mobile is another key tactic; using 4:5 vertical formats for feeds and 9:16 for Stories and Reels ensures maximum impact on screen.
Simplifying campaigns into single, focused objectives allows Meta's algorithm to optimize more effectively. Tools like Advantage+ campaigns, which automate bidding and creative adjustments, are especially helpful during peak periods when CPCs can rise by up to 69.44%. Additionally, tailoring ads to specific dietary preferences or cooking interests using Meta's advanced targeting features can further boost relevance and conversions.
These strategies highlight how the food and drink sector continues to excel, setting a high bar for performance across other industries.
6. Finance and Insurance
Average Conversion Rate (%)
The finance and insurance industries bring their own set of hurdles and rewards. With trust being a major factor and costs running high, conversion rates in this sector range from 4.87% to 9.09%. This falls just below the overall average of 9.21%, but the numbers vary significantly depending on the specific niche.
For instance, insurance stands out with a strong 18.2% conversion rate, surpassing the financial services median of 8.3% by an impressive 119%. Credit and lending follow at 8.8%, while investing lags behind with a modest 3.9%. Despite the high costs - Meta ads average $3.77 per click (the platform's highest) and a customer acquisition cost of $41.43 - advertisers still achieve a 3.50:1 return on ad spend (ROAS).
Metric | Finance & Insurance Benchmark |
|---|---|
Average Conversion Rate | 4.87% – 9.09% |
Average CPC | $3.77 (Highest across Meta platform) |
Average CPA | $41.43 |
Average ROAS | 3.50:1 |
Average CTR | 0.56% |
Key Drivers
Mobile traffic plays a crucial role in driving conversions, performing 27.8% better than desktop. While desktop remains essential for detailed processes like mortgage applications, more consumers are researching financial products on their phones. Mobile traffic achieves an average conversion rate of 11.5%, compared to 9% for desktop.
"In these sectors, you are selling 'Your Money' or 'Your Life.' The barrier to trust is high, driving up the cost of attention."
Trendtrack
Landing pages also make a massive difference. Pages written at a 5th–7th grade reading level (195–715 words) see a median conversion rate of 18.1%, far outpacing the 7.1% rate of college-level copy. Simple, easy-to-understand content clearly outperforms dense financial language.
Trends and Insights
Instagram has emerged as the top-performing social platform for finance in 2026, with a median conversion rate of 15.5%. This reflects a shift in how consumers engage with financial products, as many now explore these offerings on platforms traditionally associated with lifestyle content.
Marketers in this space are prioritizing lead quality over sheer volume. Regulatory constraints, such as those tied to Special Ad Categories for credit-related products, limit targeting options like age, gender, and zip code. As a result, advertisers rely more on broad or interest-based targeting. Additionally, the adoption of Conversions API (CAPI) has become essential, helping bypass browser tracking issues and supplying Meta's AI with accurate conversion data.
"Lead quality matters more than volume in financial services - use qualifying questions, Higher Intent forms, and offline conversion imports to optimize toward leads that actually convert."
Benly.ai
These trends highlight the importance of precision and adaptation in campaign strategies.
Optimization Opportunities
Advertisers in finance can refine their approach with targeted strategies. For instance, pre-qualifying leads directly in ad copy can prevent wasted spend on unqualified clicks. Instead of broad terms like "insurance", use specific phrases like "emergency storm damage repair" to attract high-intent prospects. Meta's Lead Ads, which autofill user details, can also boost submission rates by reducing friction.
To further optimize, simplify landing page copy by limiting the use of complex words to 35–125 words per page. Adding trust signals - such as security badges, regulatory compliance markers (e.g., NMLS, FDIC), and clear fee disclosures - can help overcome consumer skepticism. With high CPCs, rotating ad creatives frequently is essential to avoid ad fatigue and maintain a strong ROAS. Finally, connecting your CRM to Meta using CAPI ensures full-funnel tracking, enabling better decisions. After all, a $30 lead that fails to convert is far more costly than a $60 lead that results in a closed loan or policy.
7. Real Estate
Average Conversion Rate (%)
In 2026, real estate Meta Ads achieve an average conversion rate of 2.15%, placing them ahead of industries like retail (1.95%) and apparel (1.85%), but trailing behind sectors with higher intent, such as finance (4.87%) and legal services (4.64%). Cost metrics remain favorable, with an average CPC of $0.95 and a cost per lead (CPL) ranging between $16 and $38.
When it comes to audience targeting, retargeting warm audiences boasts a 15.8% conversion rate, while lookalike audiences average 12.3%, and cold, broad audiences convert at just 4.3%. The median click-through rate (CTR) for real estate ads is 2.75%, peaking at 3.88% in January 2026.
Metric | Real Estate Benchmark |
|---|---|
Average Conversion Rate | 2.15% |
Average CPC | $0.95 |
Average CPL | $16–$38 |
Average CTR | 2.75% |
Mobile Traffic Share | 68.5% |
Key Drivers
With 68.5% of traffic coming from mobile devices, ensuring that landing pages load in under three seconds is a must. Beyond speed, detecting Meta Ads anomalies like pixel failures is vital for maintaining performance. Video content plays a crucial role, as 52% of visitors engage with property tour videos. Vertical Reels featuring neighborhood stories or virtual walkthroughs are particularly effective, delivering 30–50% lower CPMs compared to static ads.
Speed is key in lead response - replying within five minutes improves lead qualification rates by 78%. For instance, a Phoenix-based brokerage with 18 agents implemented a three-layer funnel using Conversions API (CAPI) best practices in late 2025. This reduced their CPL from $95.50 to $29.50 and increased their monthly gross commission income (GCI) from $39,525 to $111,135, achieving a 12.1x ROAS.
These key drivers, paired with benchmarks by objective and placement, are reshaping real estate ad strategies.
Trends and Insights
Due to Special Ad Category restrictions, which limit demographic targeting for housing ads, the focus has shifted to the quality of creative elements like visuals, copy, and messaging. These factors now serve as the main signals for audience self-selection. Interestingly, authentic, phone-recorded testimonial videos outperform polished, studio-produced content by 44% in click-through rates.
Meta's Advantage+ Leads campaigns have shown to be more efficient, reducing costs by 22% compared to manual targeting. A luxury real estate agent in Miami used Messenger Ads with automated replies to target high-income individuals ($250K+). By mid-2025, the campaign generated 41 leads per month at $102 each, resulting in 2.1 monthly transactions and an average monthly GCI of $189,000 - a staggering 45x ROAS. WhatsApp integration is another promising tool, delivering 40–80% higher lead-to-conversation rates compared to traditional methods.
These trends highlight the growing importance of creative quality and the strategic use of automation in real estate campaigns.
Optimization Opportunities
Integrating CAPI can significantly improve Event Match Quality scores, boosting them from 3.5–5.0 (pixel-only) to 7.5–9.0. Using "Higher Intent" Instant Forms, which include a review step, helps filter out low-quality leads. For example, a boutique brokerage in Austin implemented a two-stage funnel - Video Views followed by Lead Ads targeting viewers with 75%+ watch time. This approach reduced unqualified leads by 60% and increased monthly GCI from $72,800 to $192,400.
"Creative quality now accounts for up to 56% of campaign performance variance. This contrasts with 2020, when targeting precision dominated."
Bedifly
Hybrid objective stacks can also drive better results. Start with Lead Ads to generate volume at the top of the funnel, then retarget those users with Website Conversion campaigns aimed at high-intent landing pages. This strategy can increase appointment-setting rates by up to 67%. Additionally, targeting individuals experiencing recent life events, such as getting married or changing jobs, can reveal 2.3x higher intent to buy or sell property.
2025 Meta Ads Benchmarks by Industry (CTR, CPC, CPM, CPL & ROAS)
8. Retail
The retail sector brings its own unique challenges and opportunities when it comes to conversion dynamics, shaped by the diversity of its products and consumer behaviors.
Average Conversion Rate (%)
Conversion rates in retail differ by category. Multi-brand retail leads with 3.93%, followed by fashion and apparel at 3.06%. Consumer goods sit at 2.85%, while luxury and jewelry trail with an average of 0.94%.
When it comes to costs, the average cost-per-click (CPC) is around $0.70, with fashion-specific ads costing slightly less at $0.45. Customer acquisition costs vary significantly, ranging from $22.17 in electronics to $28.08 in clothing. Mobile traffic dominates the retail space, accounting for 94–98% of ad engagement, but cart abandonment remains a major hurdle, holding steady at approximately 78%.
Key Drivers
Creative quality is the top factor influencing ad performance in retail, accounting for 70–80% of results. This is particularly important for visually-driven categories like fashion and luxury goods. Video content has become indispensable, with Reels now making up over 40% of Facebook ad impressions. Brands that fail to incorporate short-form vertical videos are falling behind.
Meta's Advantage+ Shopping Campaigns have emerged as a game-changer, delivering 15–25% higher return on ad spend (ROAS) compared to manual campaign setups. These campaigns use AI to automatically optimize targeting and budget allocation. A shift toward broader targeting - based on basic demographics like age, gender, and location - has also proven more effective than hyper-specific interest targeting.
Trends and Insights
The way people shop is shifting toward discovery-based experiences. AI-powered product recommendations are taking center stage, offering personalized, "Netflix-style" suggestions that predict shopper preferences. Social commerce is also gaining traction, with tools like Instagram Checkout making in-app purchases seamless and raising the bar for convenience.
Privacy changes, particularly on iOS, have caused a 20–30% loss in tracking signals. In response, retailers are consolidating campaigns and leaning heavily on Meta's automation tools. Dynamic Product Ads (DPA) remain essential for retargeting the 97% of users who abandon their carts. High-volume categories like apparel are now rotating creative assets daily to combat ad fatigue and maintain steady CPMs , often utilizing bulk ad testing to identify winners quickly. These trends highlight the importance of both personalized content and efficient checkout processes.
Optimization Opportunities
To keep up with the sector's demands, retailers should focus on improving checkout experiences and optimizing Meta ad conversions through creative refreshes. Offering express checkout options - like Shop Pay, Apple Pay, or Google Pay - can help address the 78% cart abandonment rate. Using a Dynamic Creative Optimization checklist allows for automatic testing of images, headlines, and calls-to-action, improving ad performance.
Investing in vertical video content is critical, given the dominance of Reels. Collection Ads, which showcase multiple products in a scrollable format, are growing in popularity, with a nearly 15% year-over-year increase in usage. For cost-effective customer acquisition, Meta Ads outperform Google Ads, with e-commerce campaigns averaging a CPC of $0.68 compared to $1.15 on Google. These strategies can help retailers maximize their efficiency and adapt to evolving consumer expectations.
9. Technology
Technology campaigns come with their own set of challenges, especially when compared to consumer-focused industries. Longer sales cycles and the need for multi-touch strategies make Meta advertising in this sector a more complex endeavor.
Average Conversion Rate (%)
When it comes to conversion rates, technology and SaaS campaigns lag behind. The average conversion rate sits at 2.31%, much lower than the global average of 9.21%. To put it into perspective, top-performing sectors like Fitness (14.29%) and Education (13.58%) far outpace technology. The electronics sub-sector fares even worse, with a conversion rate of just 0.85%.
Cost metrics paint a similar picture. The average cost-per-click (CPC) for technology ads is $1.27 - nearly three times higher than apparel's $0.45. Customer acquisition costs (CAC) are also the highest across all industries, averaging $55.21, a stark contrast to Education's $7.85. The click-through rate (CTR) in this sector is around 1.04%, placing technology in the "Below Average" category for engagement. For B2B SaaS companies, the median return on ad spend (ROAS) is approximately 1.60.
Key Drivers
One of the main reasons for these lower conversion rates is the extended decision-making process. Unlike impulse buys in retail or fitness, purchasing software or tech products often involves multiple touchpoints. Mobile traffic, which accounts for 94–98% of visits in technology campaigns, is usually research-driven rather than purchase-ready.
Creative quality plays a huge role, accounting for 70–80% of ad performance. However, the creative approach for technology ads differs from consumer goods. These ads often act as an assist channel, building brand awareness that later converts through search or direct traffic. To capture qualified leads, focusing on metrics like "Completed Registrations" or "Demo Requests" is far more effective than chasing simple link clicks.
"The advantage no longer lies in micro-segmentation. Instead, success depends on providing the algorithm with high-quality, diverse creative assets."
Bixente, Co-founder, Trendtrack
These factors make technology advertising a unique arena with its own set of trends and strategies.
Trends and Insights
Meta is shifting its focus from "impressions" to "views" as a key engagement metric, emphasizing actual content consumption. Privacy restrictions on iOS continue to disrupt data accuracy, pushing advertisers toward server-side tracking solutions.
Many brands are moving from ROAS (Return on Ad Spend) to POAS (Profit on Ad Spend) to better account for costs like COGS, shipping, and overhead. This approach is particularly relevant for SaaS companies with intricate pricing models. Advantage+ and manual campaigns have also gained traction, reaching an annual run-rate of over $20 billion by late 2024 - a 70% year-over-year increase.
Optimization Opportunities
To tackle these challenges, technology advertisers need to fine-tune their strategies. Simplifying account structures can help Meta's AI learn more effectively by pooling data. Using the Conversions API (CAPI) and GA4 can bypass browser tracking limitations, ensuring that qualified lead data is accurately captured. As retargeting becomes more restricted, crafting ad copy that pre-qualifies prospects can save budgets by filtering out less relevant users.
High-performing creatives are another key to success, though lowering creative testing costs remains a priority for tech advertisers. Ads that achieve conversion rates above 10% can keep CPMs around $25, while weaker creatives can push costs above $50. Optimizing vertical video in a 4:5 format for mobile-first platforms like Instagram Stories can boost engagement significantly - Stories, for instance, deliver 61% higher CTRs than Facebook Feed ads. Feeding CRM data back into Meta's system can also improve offline conversion tracking and better target high-value decision-makers. Finally, Meta Ads should serve as a starting point for conversations, with email funnels and nurture sequences playing a critical role in closing deals.
10. Hardware and Automotive
The hardware and automotive industries face tough challenges on Meta's platform, with an average conversion rate of just 0.37% - the lowest among all sectors analyzed.
Average Conversion Rate (%)
While conversion rates are low, there are encouraging signals. The click-through rate (CTR) is 2.58%, showing strong initial interest from users. Additionally, advertisers benefit from a relatively low customer acquisition cost of $28.82 and a CPM of $6.96, thanks to reduced auction pressure. This allows ad budgets to stretch further, even with longer purchase cycles.
"Hardware and Automotive records the lowest CR at 0.37%, which may reflect longer purchase cycles or higher-consideration products." - Lebesgue
The automotive segment shows better results, with median conversion rates hitting 1.30% in early 2026 - a 15.83% year-over-year increase. Top-performing campaigns in automotive report rates as high as 5.4%, while construction and metal building campaigns achieve impressive conversion rates of 5.5% and 9.8%, respectively.
These data points highlight the complexity of this sector and the factors influencing its performance.
Key Drivers
The low conversion rates are closely tied to the nature of the purchase process. Buying decisions in this sector often involve detailed research, price comparisons, and financing considerations, which naturally extend the decision timeline. Although 68.5% of traffic comes from mobile devices, desktop conversions (3.8%) far outpace mobile conversions (1.9%). This suggests that users start their research on mobile but move to desktops for more serious buying actions.
Visual content plays a critical role during the research phase. Features like 360-degree inventory views, video walkthroughs, 3D renders, and before-and-after galleries are highly effective at capturing interest. Trust-building elements - such as customer reviews, case studies, and detailed product specifications - help guide potential buyers toward completing their purchases.
Trends and Insights
Advertisers are increasingly leaning into feed-driven formats like Collection Ads, which saw a 15% year-over-year increase. These formats allow businesses to showcase broader inventories in a visually appealing way, aligning well with the sector's needs.
TikTok has emerged as a standout platform for automotive content, with engagement rates reaching 4.2%, compared to Facebook's 0.35%. Automotive campaigns also report a median ROAS of 2.54, proving that while conversions may be harder to achieve, their value is often worth the effort.
"The massive gap between mobile traffic (68.5%) and mobile conversion (1.9%) represents the single biggest opportunity in automotive digital marketing. Dealers who crack mobile conversion optimization will dominate their markets." - Hadis Mohtasham, Marketing Manager
Success in this sector depends on adapting to shifting consumer behaviors and leveraging platform-specific trends.
Optimization Opportunities
Closing the mobile conversion gap should be a top priority. Focus on streamlining forms, improving mobile page load speeds, and ensuring the mobile experience matches the quality of desktop interactions. Retargeting strategies can also keep your products or vehicles in front of users who browsed but didn't convert, encouraging them to complete their purchase.
Meta Lead Forms can be optimized with qualifying questions to filter out low-intent users, helping sales teams focus on serious prospects. For service-based businesses, collect first-party data through tools like appointment schedulers and quote requests. This data can be used to create custom audience segments, improving targeting precision over time.
Investing in Instagram Reels and Stories placements can boost engagement, especially with video content. Additionally, localized messaging and radius targeting - tailored to specific neighborhoods or regions - can enhance ad relevance and drive better results for local businesses.
Industry Performance Comparison
Meta Ads performance varies widely across industries, with conversion rates showing a 6-fold difference - from 14.29% in Fitness to just 2.31% in Technology. This disparity highlights the importance of setting realistic benchmarks and identifying areas for improvement based on industry-specific challenges.
Industries can be grouped into three performance tiers based on conversion rates:
High-converting industries: Sectors like Fitness (14.29%), Education (13.58%), and Healthcare (11.00%) benefit from clear value propositions and an audience with urgent needs or intent.
Mid-tier sectors: Finance (9.09%) and Legal (5.60%) see strong consumer interest but face obstacles like trust-building and competitive environments.
Lower-converting sectors: Industries such as Apparel (4.11%), Retail (3.26%), and Technology (2.31%) struggle with longer decision-making processes, higher friction at the point of conversion, and extensive research phases.
Cost structures and CPMs also show significant differences. For example, Finance and Insurance face the highest cost-per-click (CPC) at $3.77, reflecting the higher lifetime value of their customers. On the other hand, Apparel advertisers pay as little as $0.45 per click, relying on high sales volume rather than large margins. Across all industries, the average return on ad spend (ROAS) is 2.19:1, though this varies based on business models and profit margins. For a deeper look at how ROAS behaves as you increase spend, see our scaling ROAS benchmarks. If you're running ads across multiple platforms, our guide to cross-platform benchmarking KPIs breaks down which metrics matter on Meta, Google, and TikTok.
"Benchmarks don't define success – they define context." - OmegaTrove
This quote underscores the idea that benchmarks serve as a reference point rather than a rigid standard for success. Beyond conversion rates and costs, emerging trends are reshaping ad performance. For example, AI-driven tools like Meta's Advantage+ campaigns are expected to improve conversion rates by 6.2% by 2026 through better audience targeting and creative distribution. Industries that embrace Meta ads automation, rapid creative iterations, and native ad formats (like Lead Ads) are already seeing improved results.
Here's a closer look at how different industries perform and the unique challenges they face:
Industry | Avg. Conversion Rate | Performance Pattern | Primary Optimization Challenge |
|---|---|---|---|
Fitness | 14.29% | High urgency; motivated audience | Maintaining lead quality |
Education | 13.58% | High intent; younger demographic | High competition for attention |
Healthcare | 11.00% | Quick action on health concerns | Privacy regulations limiting retargeting (see conversion data compliance) |
Finance | 9.09% | High trust requirements | Managing high CPCs ($3.77) amid compliance demands |
Legal | 5.60% | High-value offers; competitive auction | Standing out in a crowded, competitive market |
Apparel | 4.11% | Volume-driven with thinner margins | Battling creative fatigue and price sensitivity |
Retail | 3.26% | High browsing, low commitment | Overcoming cart abandonment |
Technology | 2.31% | Research-heavy process | Conveying complex value propositions |
These insights provide a clearer understanding of how industries differ in Meta Ads performance, emphasizing the need for tailored strategies to address specific challenges and opportunities.
Conclusion
In 2026, Meta Ads conversion rates show significant variation across industries. For example, Restaurants & Food boast a conversion rate of 18.25%, while Luxury & Jewelry lag behind at just 0.98%. These differences stem largely from the nature of customer behavior - industries with urgent needs and simpler purchase processes thrive, while high-ticket sectors often face longer decision-making cycles that require multiple touchpoints.
When looking at benchmarks, think of them as diagnostic tools rather than rigid goals. As AdBid advises:
"The best benchmark is your own performance last month. Industry averages are starting points; continuous improvement is the goal".
If your conversion rate falls below your industry's median, aim to reach that level first before pursuing the top quartile. Use these benchmarks and AI-driven CPA analysis to uncover potential issues, such as creative wear-out in Apparel or overly complex checkouts in Retail. Implementing full-funnel AI optimization strategies can help you systematically close performance gaps. Before scaling, make sure you're setting budget guardrails to protect your margins, and track the right testing metrics by campaign goal to validate what's actually working.
Steps for 2026 Success
To improve your campaign performance, consider these strategies:
Leverage Advantage+ Shopping Campaigns: These campaigns use AI to optimize targeting and creative placement, delivering 15–25% better ROAS compared to manual setups.
Emphasize Video Content: With Reels now accounting for over 40% of Meta ad impressions, video is a must-have in your campaigns.
Align Campaign Goals to Objectives: Every campaign objective triggers a different optimization model. Getting your campaign goal alignment right from the start prevents wasted spend and sets accurate performance expectations.
Combat Ad Fatigue: In high-volume sectors, rotate creatives frequently. AI audience segmentation often outperforms manual targeting because broad targeting (age, gender, location) works better than overly detailed interest-based targeting, thanks to Meta's advanced AI.
For industries with lower conversion rates, focus on reducing friction. For instance, Facebook Lead Ads can help by capturing qualified leads without requiring users to leave the platform. E-commerce brands should also revisit their checkout process - current averages of 5.1–5.2 steps contribute to mobile cart abandonment rates as high as 69.02%. Simplifying this process can make a big difference.
When you're ready to increase spend, learn how to approach scaling ad budgets without losing ROAS — the tactics are different at $500/day than they are at $50/day.
Finally, shift your focus from vanity metrics to business outcomes. Calculate your break-even ROAS using the formula (1 ÷ Profit Margin), and consider switching to Profit on Ad Spend (POAS) to better account for your cost structure.
For ongoing optimization, AI tools for Meta Ads like AdAmigo.ai can handle tasks like account audits, launching tests, and budget adjustments, ensuring your campaigns stay on track. By combining these strategies with consistent refinement, you'll be well-positioned to close the gap between current performance and top-tier results.
FAQs
What conversion rate should I compare against for my industry?
When evaluating your conversion rate, it's essential to compare it to your industry's average, as these rates can differ significantly. For instance, legal services typically see an average conversion rate of about 5.6%, while retail averages around 3.3%, and fitness can go as high as 14.3%. To make meaningful comparisons, rely on the most recent data from trustworthy sources to ensure your insights are accurate and directly applicable to your marketing efforts.
How can I improve tracking accuracy after iOS privacy changes?
To keep your tracking accurate despite the iOS privacy changes introduced in 2026, consider using Meta's Conversion API. This server-to-server tracking method helps bypass the limitations posed by browser cookies, ensuring better data reliability.
Additionally, tools like Meta Advantage+ can improve your targeting and optimization efforts, making them more effective in this privacy-conscious landscape. Double-check that your pixel is set up correctly and explore server-side tracking techniques to maintain precise conversion measurement. These steps are essential for adapting to this evolving environment.
Should I optimize for leads, purchases, or ROAS in Meta Ads?
When deciding on a strategy, consider your industry and specific goals. For example, lead generation campaigns tend to perform well, boasting higher click-through rates (2.59%) and conversion rates reaching up to 8.78%. This makes them perfect for gathering customer information. On the other hand, if you're in e-commerce, focusing on purchases or return on ad spend (ROAS) is often more effective. Benchmarks indicate ROAS typically falls between 3.8x and 4.2x. To achieve the best results, align your approach with these industry standards and your objectives.