
Meta Ads CTR Benchmarks by Industry (2026)
Industry CTR benchmarks for Meta Ads in 2026, global averages, top and low-performing sectors, plus practical tips to boost CTR with creative, targeting, and AI.
Meta Ads click-through rates (CTR) vary significantly by industry, and understanding these benchmarks is crucial to optimizing your campaigns. A high CTR signals that your ad resonates with its audience, which can lower costs and improve performance on Meta platforms like Facebook and Instagram. Here's what you need to know:
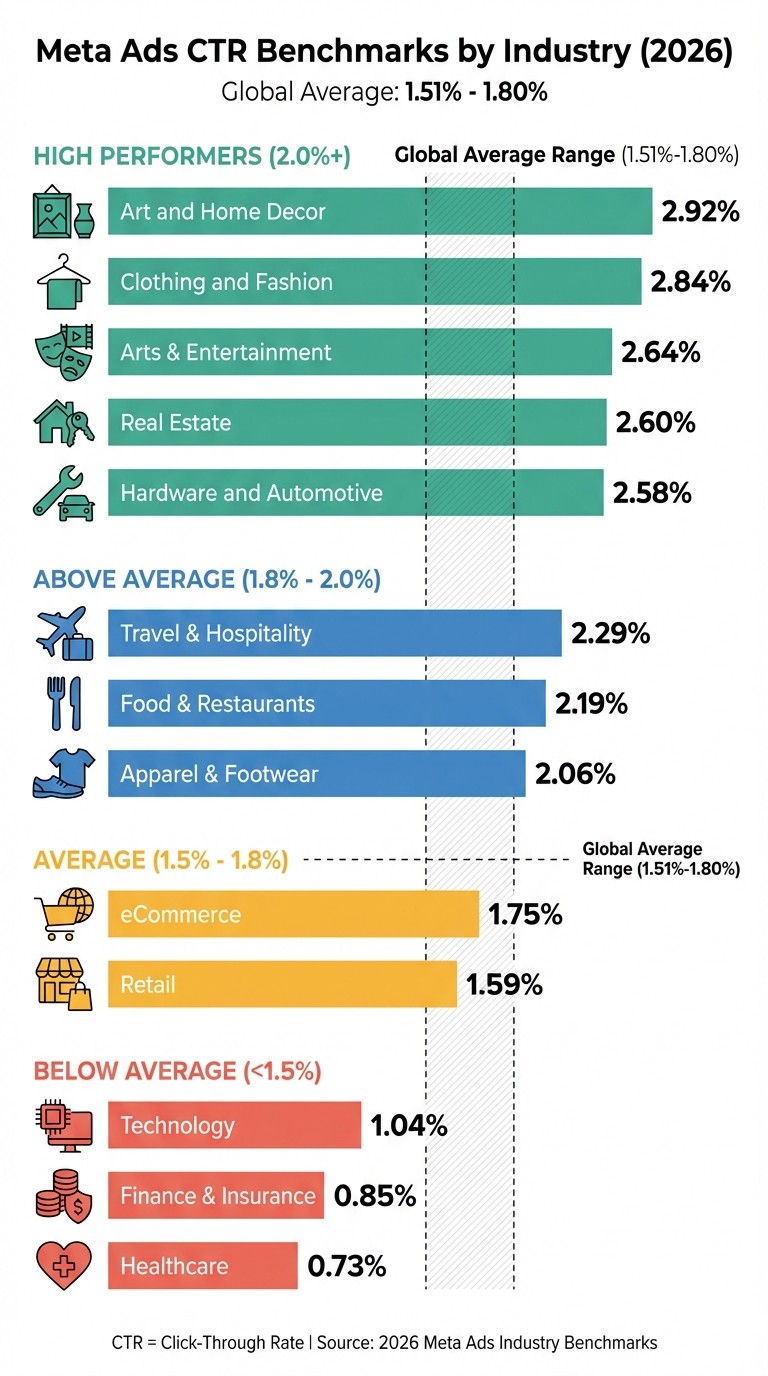
Global Average CTR (2026): 1.51%–1.80%.
Top Industries: Art & Home Decor (2.92%), Clothing & Fashion (2.84%), Real Estate (2.60%).
Low CTR Industries: Technology (1.04%), Finance & Insurance (0.85%), Healthcare (0.73%).
Key Factors: Ad quality, how AI matches creatives to audiences and placement impact CTR the most. Instagram Stories and Reels outperform Facebook Feed for engagement, often influenced by Advantage+ vs. manual placements.
To improve CTR:
Use engaging, mobile-friendly videos with strong hooks in the first 3 seconds.
Let Meta’s AI dynamically optimize targeting with broad audiences, or compare AI vs. manual audience creation to see which fits your goals.
Leverage AI tools like Advantage+ for real-time creative testing and optimization.
CTR benchmarks help you measure success and refine strategies based on your industry’s standards. High CTRs not only boost engagement but also reduce ad costs, making them a key metric for campaign success.
2025 Meta Ads Benchmarks by Industry (CTR, CPC, CPM, CPL & ROAS)
What is Meta Ads CTR and Why It Matters
CTR, or click-through rate, measures how well your ad connects with its audience by comparing clicks to impressions. This metric is essential for aligning your campaign goals with industry benchmarks, which we’ll dive into later. It’s important to distinguish between two types of CTR: CTR (All), which tracks all interactions like likes, comments, and "see more" clicks, and Link Click-Through Rate, which focuses solely on clicks that direct users to your landing page or lead form. The latter is what truly impacts your business outcomes, earning it the nickname "Money Metric" for campaign evaluation.
Why is CTR such a big deal in 2026? It’s now the main indicator Meta’s AI uses to judge ad relevance. A high CTR tells the algorithm your ad resonates with viewers, which helps it find similar users - even if you’re short on conversion data. This also affects costs. For example, at a $15 CPM, a 1% CTR means you’re paying $1.50 per click. Boost that CTR to 3%, and your cost per click drops to just $0.50.
The sections below explain how CTR is calculated and the key factors influencing it, alongside other Meta Ads benchmarks for 2026.
How CTR is Calculated
The formula for CTR is straightforward: divide the total number of clicks by the total number of impressions, then multiply by 100. For example, if your ad gets 150 clicks from 10,000 impressions, your CTR is 1.5%.
This metric is a direct reflection of how appealing your ad is before users even visit your website. A low CTR is a red flag that either your creative, offer, or targeting needs improvement. On the flip side, a high CTR signals to Meta’s algorithm that your ad is worth showing to more users, creating a positive feedback loop that boosts both reach and cost efficiency.
What Affects CTR on Meta Platforms
Several factors determine whether your CTR thrives or flounders, but some carry more weight than others.
Ad creative quality is the top influencer, accounting for 70–80% of ad performance - far more than budget or targeting settings. The visual element of your ad, whether it’s an eye-catching image or a compelling video intro, is what stops users from scrolling and grabs their attention.
Audience targeting still matters, but in 2026, its role has evolved. Your creative essentially drives targeting. For instance, if golfers engage heavily with your ad, Meta’s AI will automatically adjust to show it to similar users.
Placement selection also plays a critical role. Instagram Stories, for example, deliver 61% higher CTRs than the Facebook Feed. Reels ads often perform even better, with CTRs reaching 2.5% or more, thanks to their full-screen format.
Industry category introduces natural variations in CTR and CPC benchmarks. Real Estate ads, for instance, see CTRs around 2.60–2.70% due to their visually engaging content. In contrast, Finance & Insurance ads typically struggle with CTRs of 0.85–1.00% because of trust issues and complex offerings. What’s considered a good CTR in one industry might be subpar in another, so it’s essential to keep these benchmarks in mind.
These factors lay the groundwork for understanding how CTR varies across industries, which we’ll explore in the upcoming sections.
2026 CTR Benchmarks by Industry
Meta Ads CTR Benchmarks by Industry 2026
The table below outlines the 2026 Meta Ads benchmarks across various industries, giving you a clear view of how your campaign measures up against sector-specific standards.
Industry | Average CTR | Performance Tier |
|---|---|---|
Art and Home Decor | 2.92% | High |
Clothing and Fashion | 2.84% | High |
Arts & Entertainment | 2.64% | High |
Real Estate | 2.60% | High |
Hardware and Automotive | 2.58% | High |
Travel & Hospitality | 2.29% | Above Average |
Food & Restaurants | 2.19% | Above Average |
Apparel & Footwear | 2.06% | Above Average |
eCommerce | 1.75% | Average |
Retail | 1.59% | Average |
Technology | 1.04% | Below Average |
Finance & Insurance | 0.85% | Low |
Healthcare | 0.73% | Low |
The global average CTR for Meta traffic campaigns in 2026 is expected to range between 1.51% and 1.80%. If your CTR aligns with your industry's range, you're performing as expected. You can use an ad performance analyzer to see how your metrics stack up. If it falls short, it may be time to revisit your campaign's creative elements or targeting strategy to identify common performance bottlenecks. To fine-tune your approach, consider how your industry fits within the performance tiers outlined below.
Industries with High CTR (2.0%+)
Sectors with high CTRs often feature visually appealing products that naturally draw attention. For example:
Art & Home Decor leads with a 2.92% CTR, benefiting from eye-catching visuals that resonate with users.
Clothing & Fashion (2.84%) and Arts & Entertainment (2.64%) also perform well, leveraging aspirational and lifestyle-driven imagery.
Real Estate posts a solid 2.60% CTR, with property photos and virtual tours playing a key role in engaging audiences.
Hardware and Automotive (2.58%) thrives on showcasing sleek designs and product functionality.
These industries capitalize on the power of visuals to create immediate interest and drive clicks.
Industries with Above Average CTR
Industries like Food & Restaurants (2.19%) and Apparel & Footwear (2.06%) perform above the global average. Their success lies in balancing visual appeal with consumer decision-making - users may not make immediate purchases, but the content still prompts engagement.
Meanwhile, eCommerce (1.75%) and Retail (1.59%) fall into the average tier. These sectors often rely on AI-driven tools like Advantage+ Shopping Campaigns to connect products with the right audience automatically. However, the competitive nature of these spaces means that strong offers and standout visuals are essential to maintain engagement. Implementing bulk ad testing with AI can help identify which combinations resonate best with these competitive audiences.
Industries with Lower CTR (Below 1.5%)
Some industries, particularly those involving complex offerings or longer decision cycles, see lower CTRs. For instance:
Technology (1.04%), Finance & Insurance (0.85%), and Healthcare (0.73%) face unique challenges. These include the need to educate audiences, build trust, and address high-consideration purchases.
For B2B and specialized services, lower CTRs don't necessarily signal failure. Instead, they reflect the nature of industries where consumers require more time and information before taking action. Tailored messaging and educational content can help address these challenges effectively.
CTR by Campaign Objective and Ad Placement
Campaign objectives and ad placements play a major role in shaping your click-through rate (CTR) and overall ad performance.
CTR by Campaign Objective
Different campaign objectives yield varying CTRs, largely because some focus more on reach than on driving clicks. For instance, Lead Generation campaigns (often utilizing lead forms vs. landing pages) boast the highest average CTR at 2.59%, followed by Traffic campaigns at 1.71%.
On the other hand, Sales and Conversion campaigns have a lower CTR, averaging 1.38%. This is mainly because Meta’s algorithm prioritizes targeting high-intent users, who tend to click only when they’re ready to act. Unsurprisingly, Awareness campaigns record the lowest CTR at 0.94%, as their primary goal is to maximize reach rather than prompt immediate user interaction.
Campaign Objective | Average CTR | Year-over-Year Change |
|---|---|---|
Lead Generation | 2.59% | +0.02% |
Traffic | 1.71% | +0.06% |
Engagement | 1.42% | +0.11% |
Sales / Conversions | 1.38% | +0.14% |
Video Views | 1.21% | +0.08% |
Awareness | 0.94% | +0.03% |
It’s important to use the right metrics for evaluation: "Link CTR" for Sales and Traffic campaigns, and "CTR (All)" for Engagement campaigns. These metrics should not be compared directly. To ensure your tracking is accurate, follow a conversion optimization checklist to align your setup with your goals.
Ad placement also plays a key role in shaping CTR outcomes.
CTR by Ad Placement
If campaign objectives guide intent, ad placement determines how effectively your audience engages with your ads. Placement impacts both visibility and interaction levels, making it a critical factor in performance.
Among placements, Instagram Stories lead with a 1.34% CTR, accounting for 22% of all Meta ad traffic. Facebook Feed follows closely with a 1.11% CTR, contributing the largest traffic share at 31%. This makes Facebook Feed a reliable choice for campaigns aiming for consistent performance.
Instagram Reels, while showing a lower average CTR of 0.76%, can achieve impressive results - up to 3.8% CTR - when combined with creator-driven User Generated Content (UGC).
The secret lies in creative-placement alignment. For example, vertical videos in a 9:16 format are non-negotiable for Reels and Stories. Ads that don’t follow this format often fail to engage users. Additionally, hooks should grab attention within the first three seconds to prevent users from swiping away.
Video ads generally outperform static images, achieving CTRs between 1.5% and 2.5%, compared to 0.8% to 1.5% for static formats. Interestingly, native-style videos on Reels often surpass polished studio content in engagement, especially in 2026 trends. Meanwhile, Advantage+ campaigns, powered by AI, enhance CTR by 15–20% through real-time creative optimization.
Keep an eye on ad frequency - once it hits 2.5–3.0, it’s time to refresh your creative assets to avoid audience fatigue.
How to Improve Your Meta Ads CTR
Boosting your click-through rate (CTR) on Meta Ads requires a mix of strategies tailored to how Meta's algorithm functions in 2026. These strategies focus on three essential pillars: creative execution, audience targeting, and AI-driven automation.
Optimize Your Ad Creative
Your ad creative isn’t just about catching the viewer’s eye anymore - it’s how Meta’s AI determines the right audience for your content. In 2026, the phrase "creative is targeting" has taken on a literal meaning. The algorithm identifies audience segments based on who interacts with your content, making your creative a vital tool for audience precision.
Low-production, mobile-shot videos are outperforming polished, studio-quality ads. These so-called "ugly ads" blend seamlessly into users' feeds, avoiding the polished look that feels like an interruption. Ads like these frequently achieve CTRs above 3.0%. Similarly, founder-led videos - simple, direct-to-camera clips featuring a real person - are seeing CTRs of 2–3%. In an era where AI-generated content is everywhere, these authentic videos build trust and help solve creative fatigue.
To succeed, your video must grab attention immediately. Meta’s algorithm deprioritizes content that fails to engage within the first three seconds. Use techniques like pattern interrupts (unexpected visuals or movements), open loop hooks ("The #1 mistake..."), or the "Comment" strategy, which uses a glowing customer review as the centerpiece of your ad for instant credibility.
"If your creative doesn't stop the scroll in the first 3 seconds, the algorithm deprioritizes you almost instantly." - Two Minute Reports
For retargeting campaigns, consider using static images with clear, compelling testimonials. These often outperform videos in driving clicks.
Refine Your Audience Targeting
Once your creative is optimized, allow it to guide your audience targeting. The days of manually defining specific demographics, like "35-year-old golfers", are fading. Instead, your creative’s performance will signal to Meta’s AI which audience segments are most relevant. High CTRs on specific content help the algorithm identify your ideal audience.
Broad audiences work better. Meta’s AI thrives on larger datasets, dynamically identifying high-intent users. Over-filtering by interests or demographics can limit the algorithm’s ability to uncover patterns you might overlook. By using Dynamic Creative Testing (DCT), you can upload multiple headlines, visuals, and texts, letting Advantage+ determine the best combinations for each audience segment.
To maintain a high CTR, exclude previous buyers using a 180-day exclusion list through the Conversions API (CAPI). This tool also bypasses browser restrictions, ensuring cleaner data for better optimization.
Use AI Tools to Automate Optimization
AI tools have evolved beyond analytics - they now actively manage and optimize campaigns. Incorporating the best AI tools for Facebook and Instagram ads can amplify your results.
AdAmigo.ai: This AI media buyer continuously audits your account, identifies opportunities, and optimizes performance in real-time. Features like AI Autopilot adjust budgets and launch campaigns automatically, while the Ad Factory generates creative variations to prevent fatigue. The Bulk Ad Launcher can deploy hundreds of ads in minutes.
AdManage.ai: Ideal for launching 100–300 creative and targeting combinations simultaneously, it preserves social proof by using Post IDs.
AdBid.me: Tracks campaign performance against industry benchmarks, flagging underperformers for quick adjustments.
Advantage+ campaigns have proven especially effective, delivering CTRs 15–20% higher than manual setups. This is because the AI tests over 150 creative combinations to match the right ad with the right user. To maximize these tools, provide clean data through CAPI and ensure you have plenty of creative variations for testing.
"The businesses that win in paid advertising don't chase cheap clicks – they engineer profitable systems." - Omega Trove Consulting
Conclusion
CTR benchmarks are an essential tool for understanding how your campaigns are performing. For instance, while a 1.2% CTR might seem low in Real Estate (where averages hover between 2.45% and 2.70%), it’s considered reasonable in Finance, where CTRs often struggle to surpass 1.00%. These benchmarks act as a guide, helping you distinguish between underperformance and the challenges of operating in a more competitive or niche industry.
As discussed earlier, CTR plays a key role in shaping Meta’s AI-driven ad targeting. A higher CTR signals to the algorithm that your content resonates with users, prompting it to find and target similar high-intent audiences. This is especially important as privacy regulations restrict traditional tracking methods. Additionally, CTR directly impacts costs - ads with a 3% CTR, for example, can significantly reduce cost-per-click compared to those with a 1% CTR.
To achieve competitive CTRs, focus on three main strategies:
Optimize your creative: Use raw, engaging content that grabs attention within the first three seconds.
Refine targeting: Allow your creative to guide Meta’s AI instead of relying solely on manual demographic filters.
Leverage AI tools: Features like Advantage+ campaigns, which test over 150 creative combinations, have been shown to boost CTRs by 15–20%.
CTR benchmarks are more than just numbers - they’re a critical indicator of campaign health in today’s data-driven advertising world. By combining these benchmarks with AI-powered tools and compelling creative, you can build campaigns that not only perform well but also adapt to evolving trends and challenges.
FAQs
Which CTR should I track: Link CTR or CTR (All)?
In 2026, keeping an eye on Link CTR will be crucial for Meta ads (Facebook and Instagram). This metric shows the percentage of impressions that lead to clicks on your link or call-to-action, making it a solid choice if your goal is to drive traffic or conversions.
On the other hand, CTR (All) accounts for all types of interactions, like likes and comments. While useful for gauging general engagement, it doesn’t specifically measure how many users are clicking through to your site. For a clearer picture of ad performance focused on site visits, Link CTR is the better option.
What’s a good CTR for my industry if I’m running sales campaigns?
A solid CTR for Meta sales campaigns in 2026 generally ranges from 1.24% to 2.06%, though this can vary by industry. For instance, industries like legal and retail often achieve averages between 1.61% and 1.75%, indicating robust results. These benchmarks can serve as a guide to assess and improve your ad performance.
How can I raise CTR without narrowing my audience too much?
To improve your click-through rate (CTR) without limiting your audience too much, concentrate on refining your ad creatives and placements. Use engaging formats like Reels and Stories, which tend to capture attention quickly. Leverage AI tools to tailor your ads, making them more relevant to your audience. Try different placements, such as Instagram Reels or the Facebook Feed, and tweak your messaging to better match what your audience cares about. These tactics can help you boost engagement while keeping your reach broad.