
Meta Ads CPM (and CPC) Benchmarks by Country in 2026
Global ad CPM and CPC benchmarks by country for 2026—compare high-cost and low-cost markets, seasonal spikes, and AI-driven optimization.
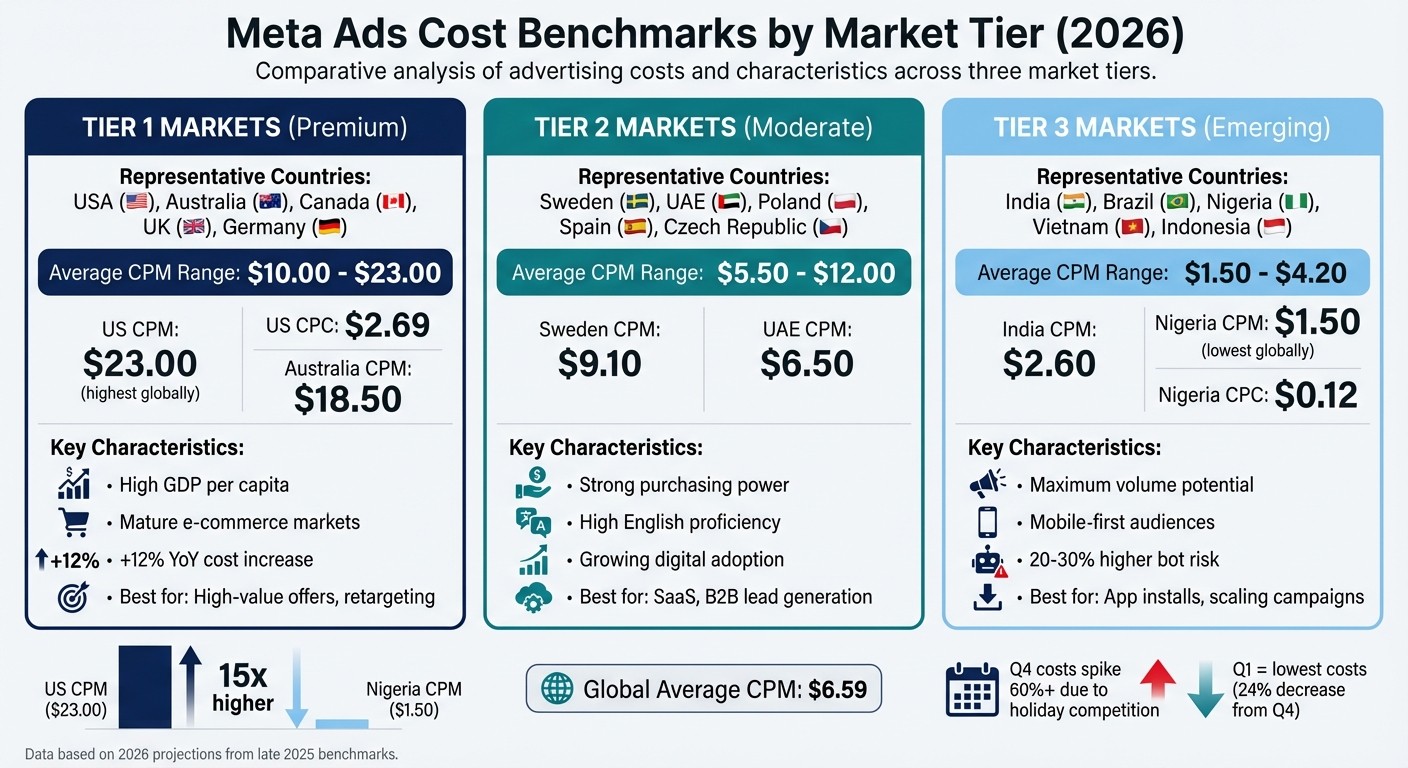
Meta ad costs vary widely in 2026, depending on the country and market tier. The global average CPM is $6.59 (alongside rising CPA benchmarks), with the U.S. leading at $23.00 CPM, while Nigeria offers the lowest at $1.50. CPC rates also differ significantly, from $2.69 in the U.S. to $0.12 in Nigeria. These benchmarks help advertisers manage budgets effectively and refine strategies for different regions.
Key Takeaways:
Tier 1 markets (U.S., Australia, UK): High costs, with CPMs ranging from $10.00 to $23.00.
Tier 2 markets (Germany, UAE): Moderate costs, CPMs between $6.50 and $12.00.
Tier 3 markets (India, Nigeria): Lower costs, CPMs from $1.50 to $4.00.
Seasonal trends: Q4 sees the highest costs due to holiday competition, while Q1 offers cheaper opportunities.
AI Impact: Tools like Meta's Advantage+ automation helps optimize campaigns, reducing costs and improving targeting.
For advertisers, understanding these benchmarks is crucial for balancing cost-efficiency and campaign performance. Adjust targeting, creative formats, and campaign objectives based on the market and season to maximize ROI.
Meta Ads CPM and CPC Benchmarks by Market Tier 2026
2025 Meta Ads Benchmarks by Industry (CTR, CPC, CPM, CPL & ROAS)
Meta Ads CPM and CPC Benchmarks by Country
Here's a detailed breakdown of Meta Ads CPM and CPC benchmarks across 45 countries, categorized by market tier. All figures are in USD, reflecting projections for 2026 based on industry benchmarks and late 2025 data. Understanding historical benchmarking basics is essential for interpreting these shifts or benchmarking your own performance. The "Typical CPM Range" accounts for seasonal trends and audience targeting variations across different placements. Below, Tier 1 markets are highlighted as examples of high-cost environments requiring precise targeting strategies.
Country | Avg. CPM | Avg. CPC | Typical CPM Range | Notes |
|---|---|---|---|---|
United States | $23.00 | $2.69 | $18.00–$28.00 | Highest costs; +12% YoY inflation; Q4 spikes to $28+ |
Australia | $18.50 | $2.10 | $15.00–$22.00 | High competition; mature e-commerce market |
Canada | $13.40 | $1.75 | $11.00–$16.00 | Mirrors US trends; strong retail presence |
New Zealand | $11.20 | $1.60 | $9.00–$13.50 | Stable premium market; English-speaking |
United Kingdom | $10.31 | $1.95 | $8.50–$12.50 | Retail saturated; high engagement rates |
Germany | $10.05 | $1.45 | $8.00–$12.00 | Strong purchasing power; EU leader |
Singapore | $12.00 | $1.80 | $10.00–$14.00 | Tech hub; high digital adoption |
Sweden | $9.10 | $1.30 | $7.50–$11.00 | High English fluency; efficient ROI |
France | $8.05 | $1.15 | $6.50–$9.50 | Moderate competition; language targeting needed |
UAE | $6.50 | $1.40 | $5.00–$8.00 | High AOV potential; luxury market |
Spain | $5.80 | $0.85 | $4.50–$7.00 | Lower-cost European entry point |
South Africa | $4.20 | $0.65 | $3.50–$5.50 | English-speaking gateway to Africa |
Brazil | $4.20 | $0.35 | $3.50–$5.00 | Mature e-commerce; Pix payment adoption |
Philippines | $3.50 | $0.28 | $2.80–$4.50 | B2B lead gen hub; high English proficiency |
Indonesia | $2.80 | $0.18 | $2.20–$3.50 | Massive scale; mobile-first behavior |
India | $2.60 | $0.20 | $2.00–$3.20 | Maximum volume; lowest entry costs |
Vietnam | $2.10 | $0.15 | $1.70–$2.80 | Rapidly digitizing; high growth potential |
Nigeria | $1.50 | $0.12 | $1.20–$2.00 | Lowest cost; high bot risk (20–30% above Tier 1) |
Switzerland | $14.80 | $2.40 | $12.00–$17.50 | Highest purchasing power in Europe |
Norway | $10.50 | $1.55 | $8.50–$12.50 | High GDP; limited market size |
Denmark | $9.80 | $1.45 | $8.00–$11.50 | Strong digital infrastructure |
Netherlands | $9.20 | $1.35 | $7.50–$11.00 | High English adoption; e-commerce mature |
Belgium | $8.40 | $1.20 | $7.00–$10.00 | Bilingual targeting required |
Austria | $9.50 | $1.40 | $7.80–$11.20 | German-speaking premium market |
Ireland | $10.80 | $1.70 | $9.00–$12.80 | Tech sector concentration |
Italy | $7.20 | $1.05 | $6.00–$8.50 | |
Poland | $5.50 | $0.75 | $4.50–$6.80 | Growing SaaS market; EU access |
Portugal | $6.10 | $0.90 | $5.00–$7.50 | Emerging digital economy |
Greece | $5.90 | $0.85 | $4.80–$7.20 | Tourism-heavy seasonality |
Czech Republic | $6.20 | $0.95 | $5.00–$7.50 | Central European gateway |
Japan | $11.50 | $1.85 | $9.50–$13.50 | High competition; language barrier |
South Korea | $10.20 | $1.65 | $8.50–$12.00 | Mobile-first; strong local platforms |
Taiwan | $8.80 | $1.30 | $7.20–$10.50 | Tech-savvy audience |
Hong Kong | $12.50 | $1.90 | $10.00–$15.00 | Financial hub; limited scale |
Malaysia | $4.80 | $0.55 | $4.00–$6.00 | Bilingual market; growing middle class |
Thailand | $3.90 | $0.40 | $3.20–$4.80 | Tourism and e-commerce growth |
Mexico | $4.50 | $0.45 | $3.70–$5.50 | Spanish-language scaling opportunity |
Argentina | $3.80 | $0.38 | $3.00–$4.80 | Economic volatility affects consistency |
Chile | $5.20 | $0.60 | $4.30–$6.50 | Stable Latin American market |
Colombia | $4.00 | $0.42 | $3.30–$5.00 | Growing digital adoption |
Peru | $3.70 | $0.36 | $3.00–$4.60 | Emerging e-commerce market |
Egypt | $2.90 | $0.25 | $2.30–$3.80 | Large population; payment challenges |
Kenya | $2.40 | $0.22 | $1.90–$3.10 | Mobile money integration (M-Pesa) |
Pakistan | $2.20 | $0.19 | $1.80–$2.90 | High volume; payment infrastructure developing |
Bangladesh | $2.00 | $0.16 | $1.60–$2.60 | Massive scale; mobile-first |
Tier 1 Markets: High-Cost Countries
Tier 1 markets, such as the United States, Australia, Canada, and Western Europe, report CPMs ranging from $10.00 to $23.00. These regions stand out for their high GDP per capita, advanced e-commerce systems, and competitive ad auctions.
What Affects CPM and CPC on Meta Ads
This section dives into the main factors that influence CPM (cost per thousand impressions) and CPC (cost per click) on Meta Ads, helping you understand what drives these costs and how to manage them effectively.
Your campaign objective is one of the biggest factors shaping your costs. For example, Reach and Impressions campaigns in the U.S. usually cost between $10.00 and $15.00 CPM. On the other hand, Lead Generation campaigns can range from $25.00 to $40.00, while Sales campaigns land somewhere in the middle at $20.00 to $30.00. Bottom-funnel objectives like Sales face higher competition, which drives up costs.
Geography and market tier also play a major role. Costs vary significantly based on factors like purchasing power, e-commerce adoption, and local competition. For instance, Tier 1 markets experienced a 12% increase in costs year-over-year through late 2025, largely due to retail media saturation.
Creative performance is another critical factor. Ads with high click-through rates (CTR) and engagement can lower your CPC by improving relevance scores. However, stronger creatives might increase your CPM. For example, financial advertisers face the highest CPC at $3.77, while apparel brands enjoy much lower costs at $0.45.
Targeting breadth affects efficiency as well. Narrow targeting often leads to higher CPMs, while broader audiences allow Meta’s algorithm to optimize more effectively. If you need to debug Meta Ads conversion tracking because your Meta Pixel or Conversion API data is inaccurate, you may face higher CPMs because the algorithm lacks the data it needs to optimize properly.
Placement and format also matter. Instagram Feed ads average $3.35 CPC and $7.68 CPM, while Instagram Stories are more affordable at $1.83 CPC and $6.25 CPM due to their immersive, full-screen format. Dynamic Product Ads targeting new audiences typically cost $10.00–$15.00 CPM, whereas static image ads with manual targeting can soar to $30.00–$50.00 CPM.
CPM vs CPC: When to Use Each
CPM optimization works best for awareness campaigns where reach and frequency are key. If your goal is to build brand recognition - like during a product launch or when targeting a specific audience repeatedly - CPM is the way to go. In the U.S., Reach and Impressions campaigns average $10.00–$15.00 CPM, making them a cost-efficient option for brand recall.
CPC optimization, on the other hand, is ideal for campaigns targeting narrow, high-value audiences. This approach is especially useful for remarketing or testing new audience segments before scaling up to conversion objectives. While Traffic and Engagement campaigns average $15.00–$25.00 CPM, they give you more control over who clicks through to your site.
The choice between CPM and CPC depends on your goals. CPM offers predictable costs and broad exposure, while CPC ensures you only pay for actions. For Sales campaigns, CPM typically ranges from $20.00 to $30.00, as Meta’s algorithm focuses on optimizing for conversions regardless of the billing method.
How Seasonality Changes Costs
The holiday season (Q4) brings the highest costs of the year for most industries. CPMs can spike by over 60% during this period due to increased competition from retail advertisers vying for limited ad inventory.
Q1, by contrast, offers the lowest costs as competition drops after the holiday rush. For example, global median CPC peaked at $1.32 in November 2025 but fell to $0.85 by January 2026 - a 24% year-over-year decrease. This post-holiday "cooling period" is a great time to acquire customers at lower costs while competitors scale back their budgets.
Election years can also disrupt ad costs. During the 2024 election cycle, over $3 billion was spent on digital ads, with half of that concentrated in the final 30 days. This influx of political spending displaced traditional advertisers, driving up CPMs across all categories.
To combat seasonal cost spikes, many advertisers start holiday campaigns earlier. By targeting high-intent shoppers before Black Friday, you can avoid peak CPMs and potentially save 20%–30% on costs.
How Targeting, Optimization Events, and Creative Format Change CPM
Broad targeting tends to be more cost-effective than narrow targeting. Campaigns with broad audiences average $8.00–$10.00 CPM, while narrow interest-based targeting can jump to $10.00–$15.00. Tight custom audiences or remarketing segments can go even higher, reaching $15.00–$25.00 CPM. Meta’s AI performs better when you loosen demographic and interest constraints, allowing your creative to attract the right users instead.
Optimization events also impact costs. In markets like India or Brazil, where bot traffic can be 20%–30% higher than in Tier 1 markets, avoid optimizing for link clicks. Instead, focus on purchase or value-based events to ensure the algorithm targets real buyers. Lead Generation campaigns with strong creatives (10%–15%+ conversion rates) can maintain CPMs around $25.00, while weaker creatives may push costs above $50.00.
Creative formats influence both cost and performance. Video ads and Reels often perform better, even as Instagram engagement rates fell 28% year-over-year to 0.50%. Instagram Stories, for example, provide cheaper reach at $6.25 CPM compared to $7.68 for Feed placements, making them ideal for direct calls-to-action. Dynamic Product Ads targeting new audiences average $10.00–$15.00 CPM, much lower than static ads at $30.00–$50.00 CPM.
"With well-performing creatives - conversion rate above 10–15% - and a steady flow of lead events, CPM can remain around $25. For less effective categories or creatives, CPM often moves into the $50+ range." - Affect Group
Finally, tracking accuracy is crucial for long-term efficiency. Following Meta API integration best practices for CAPI ensures reliable data, which helps lower CPM. Without proper tracking, your CPM will rise as the algorithm struggles to find efficient audiences. This highlights the importance of aligning your tracking setup with your overall campaign strategy.
Using AI Tools to Optimize Meta Ad Campaigns
AI-powered tools are revolutionizing how advertisers approach Meta campaigns, slashing CPMs while boosting overall performance. Tools like AdAmigo.ai and Meta's Advantage+ suite streamline targeting and ad placements, making campaigns more efficient and improving CPC metrics. Instead of relying on narrow manual targeting, these platforms use broader audience inputs combined with "targeting cues" embedded in creative messaging. This shift allows algorithms to zero in on high-value users. Let’s break down how AI enhances cost efficiency and campaign flexibility.
How AI Lowers CPM and Improves Performance
AI tools excel at analyzing campaign data to fine-tune targeting and creative formats. By reallocating budgets in real time, they focus on high-performing ads while quickly pausing those that underperform, saving money and maximizing ROI. This round-the-clock optimization is particularly useful in markets prone to bot traffic. Instead of chasing link clicks, AI prioritizes purchase-driven or value-based events, filtering out low-quality traffic.
A key driver of this efficiency is creative-led targeting. By 2026, the creative format and copy have become the primary targeting mechanisms. AI algorithms now favor broad targeting paired with content-rich creatives. This approach helps the system identify high-value users based on engagement patterns rather than locking into rigid demographic filters. For example, platforms like AdAmigo.ai can automatically generate image and video ads optimized for conversions. They also A/B test multiple creative variations to uncover the most cost-effective options, driving down CPM.
Another essential element is implementing the Facebook Conversion API (CAPI). By feeding Meta's AI reliable server-side data, CAPI ensures the algorithm has a strong foundation for optimization. Without this data pipeline, even the most advanced AI tools struggle to deliver consistent results.
"You will likely see better metrics in your Meta advertising reports with Advantage+, but who are you actually advertising to? My suggestion is to either use Advantage+ sparingly or have quality control in place." - Brett McHale, Founder, Empiric Marketing
AI doesn’t just make real-time adjustments - it also offers continuous, automated campaign management benefits.
Benefits of 24/7 Automated Campaign Management
AI-powered systems provide around-the-clock optimization, eliminating the need for constant manual oversight. These tools adjust bids, reallocate budgets to high-performing ad sets, and pause underperformers, ensuring stable performance levels that would otherwise require a dedicated team to manage.
The time savings are significant. Bulk launch features allow advertisers to deploy multiple ads with optimized copy, creative, and targeting in one go, cutting hours of manual setup. Real-time performance dashboards also allow for quick adjustments, helping to avoid budget waste during seasonal spikes or unexpected cost changes.
AI tools shine when it comes to predictive seasonality adjustments. Advanced systems can forecast performance trends, helping advertisers "jump start" holiday campaigns during periods of high consumer intent but lower CPMs - like the days leading up to Black Friday. This proactive strategy helps avoid the steep CPM increases, often exceeding 60%, that occur during peak Q4 competition.
For agencies and in-house teams juggling multiple accounts, AI tools can manage 4–8× more campaigns than manual methods. This scalability allows senior strategists to focus on big-picture planning while AI handles the day-to-day execution. By automating these tasks, AI ensures campaigns maintain consistent performance without requiring constant human intervention.
Key Takeaways
Global Benchmark Summary
Meta ad costs in 2026 show striking differences across regions. The United States tops the list with a CPM of $23.00 - about 15 times higher than Nigeria's $1.50. Tier 1 markets like the US, Australia, and Canada saw a 12% year-over-year increase in ad costs, largely due to heightened competition. On the other hand, Tier 2 markets, such as Sweden ($9.10 CPM) and the UAE ($6.50 CPM), offer strong purchasing power and high English proficiency at a fraction of Tier 1 costs. Meanwhile, Tier 3 markets like Brazil ($4.20 CPM) and India ($2.60 CPM) are excellent for scaling campaigns, but advertisers should account for bot traffic, which can range from 20–30% in these regions.
Seasonal trends are also noteworthy. The global median CPM hit a high of $25.22 in November 2025, only to fall to $15.74 by January 2026. Campaign objectives further influence pricing: in the US, Lead Generation campaigns average $25–$40 CPM, while Reach campaigns typically cost $10–$15. Meta CPCs by platform and format (Instagram CPCs ($1.83–$3.35) consistently surpass those on Facebook ($1.06–$1.72).83–$3.35 for Instagram vs. Instagram CPCs ($1.83–$3.35) consistently surpass those on Facebook ($1.06–$1.72).06–Instagram CPCs ($1.83–$3.35) consistently surpass those on Facebook ($1.06–$1.72).72 for Facebook), thanks to stronger competition and a more engaged audience.
These benchmarks highlight not just regional variations but also provide actionable insights for optimizing your campaigns.
How to Use These Benchmarks
Using these benchmarks effectively means treating them as flexible guidelines rather than fixed rules. If your CPM is higher than the typical range for your region or campaign objective, it's a signal to revisit your creative performance benchmarks. For Tier 1 markets, prioritize retargeting and promoting high-lifetime-value offers to justify the 6–7× higher costs compared to emerging markets. Tier 2 markets are ideal for SaaS and B2B lead generation, while Tier 3 markets are better suited for app installs or low-cost products.
In emerging markets, avoid optimizing for link clicks. Instead, focus on purchase or value-based events to help Meta's algorithm filter out low-intent traffic. Consider implementing the Meta Pixel vs. Conversions API for better server-side optimization. If your Feed CPM exceeds $7.47, experiment with placements like Reels and Stories, which often deliver more affordable reach.
Leverage broad targeting but incorporate "targeting cues" directly into your creative to guide Meta's automated systems more effectively. Tools like AdAmigo.ai can simplify creative testing and reallocate budgets, allowing a single media buyer to scale campaigns without sacrificing performance.
FAQs
How do seasonal trends affect the cost of Meta Ads over the year?
Seasonal trends play a big role in shaping the cost of Meta Ads. This fluctuation mainly stems from shifts in consumer behavior and the level of competition among advertisers. For instance, during high-demand periods like Q4 - especially around the holidays - CPM (cost per thousand impressions) and CPC (cost per click) tend to rise. Why? Advertisers ramp up their spending to tap into the surge in seasonal demand. On the flip side, quieter times like Q1 or the post-holiday months often bring lower costs, as competition eases and budgets shrink.
Beyond seasonal demand, factors like automation tools (e.g., Advantage+) and tweaks to targeting strategies can also impact ad costs. By understanding these patterns, advertisers can better plan their campaigns, allocate budgets wisely, and make the most of their ad spend throughout the year.
How does AI optimize Meta Ads campaigns in 2026?
In 2026, AI has become a game-changer for Meta Ads campaigns, taking over tasks like audience targeting, bid automation, and refining creative performance. By processing massive amounts of data, AI identifies the most relevant audiences, adjusts bids dynamically in real time, and fine-tunes ad delivery to boost return on ad spend (ROAS). Tools like Advantage+ use AI to sharpen targeting and placements, directly influencing costs such as CPM (cost per thousand impressions) and CPC (cost per click).
AI also plays a major role in testing and personalizing ad creatives. It ensures that ads deliver messaging that connects with audiences and drives engagement. By keeping up with market trends, seasonal shifts, and competitive changes, AI helps advertisers make smarter decisions, manage budgets wisely, and maintain an edge in the fast-moving world of digital advertising.
Why do CPM and CPC rates differ so much between countries?
CPM (cost per thousand impressions) and CPC (cost per click) rates can differ significantly from one country to another, influenced by several important factors. One of the biggest drivers is market competition. For instance, in highly competitive advertising markets like the United States, rates tend to be higher because a larger number of advertisers are bidding for the same audience. In contrast, markets with less competition often see lower CPMs and CPCs.
Economic conditions also play a big role. Countries with higher income levels and stronger purchasing power, such as the U.S., typically experience higher advertising costs compared to regions where consumer spending is lower. To put it in perspective, CPMs in the U.S. might hover around $20, while in developing countries, they could drop to as little as $1.50.
Other factors include seasonality - ad costs often surge during high-demand periods like Q4 - and targeting and creative choices. Ads with advanced targeting or high-quality creative formats tend to yield better results, which can push CPMs higher. These variations highlight how factors like economic conditions, digital infrastructure, and audience behavior shape advertising costs in different markets.