
How to Aggregate Multi-Channel Conversion Data
Centralize and deduplicate conversions, standardize UTMs, implement server-side tracking, and set attribution for accurate cross-channel reporting.
Aggregating multi-channel conversion data is crucial for marketers running campaigns across platforms like Google, Meta, TikTok, and LinkedIn. Each platform reports conversions differently, often inflating numbers and creating inconsistencies. By centralizing your data into a unified system, you can eliminate duplicate conversions, standardize metrics, and gain a clearer picture of your marketing performance.
Key Takeaways:
Why It Matters: Platforms often over-report conversions (by 2–4x). Aggregating data prevents inflated totals and ensures accurate reporting.
Steps to Take:
Audit all platforms (e.g., Meta, Google, LinkedIn, Shopify) for tracking and attribution methods.
Standardize event names and UTM parameters to align data.
Use a single data aggregation tool (e.g., Funnel.io, Supermetrics) to consolidate and clean data.
Implement server-side tracking to capture more accurate conversion signals.
Set attribution rules (e.g., Data-Driven Attribution for accounts with 50+ conversions/month).
Benefits: Teams save up to 80% of reporting time and improve marketing efficiency by 15–25%.
Quick Action Plan:
List all platforms tracking conversions and their Meta Ads attribution rules.
Create consistent naming conventions for events and UTMs.
Choose an aggregation tool that fits your budget and needs.
Integrate server-side tracking for better data accuracy.
Build dashboards tailored to executives, analysts, and specialists.
Centralizing your data doesn’t just save time - it ensures smarter decisions based on accurate, unbiased metrics. Start by connecting a few platforms and enforcing consistent naming. Expand your system gradually for better insights and efficiency.
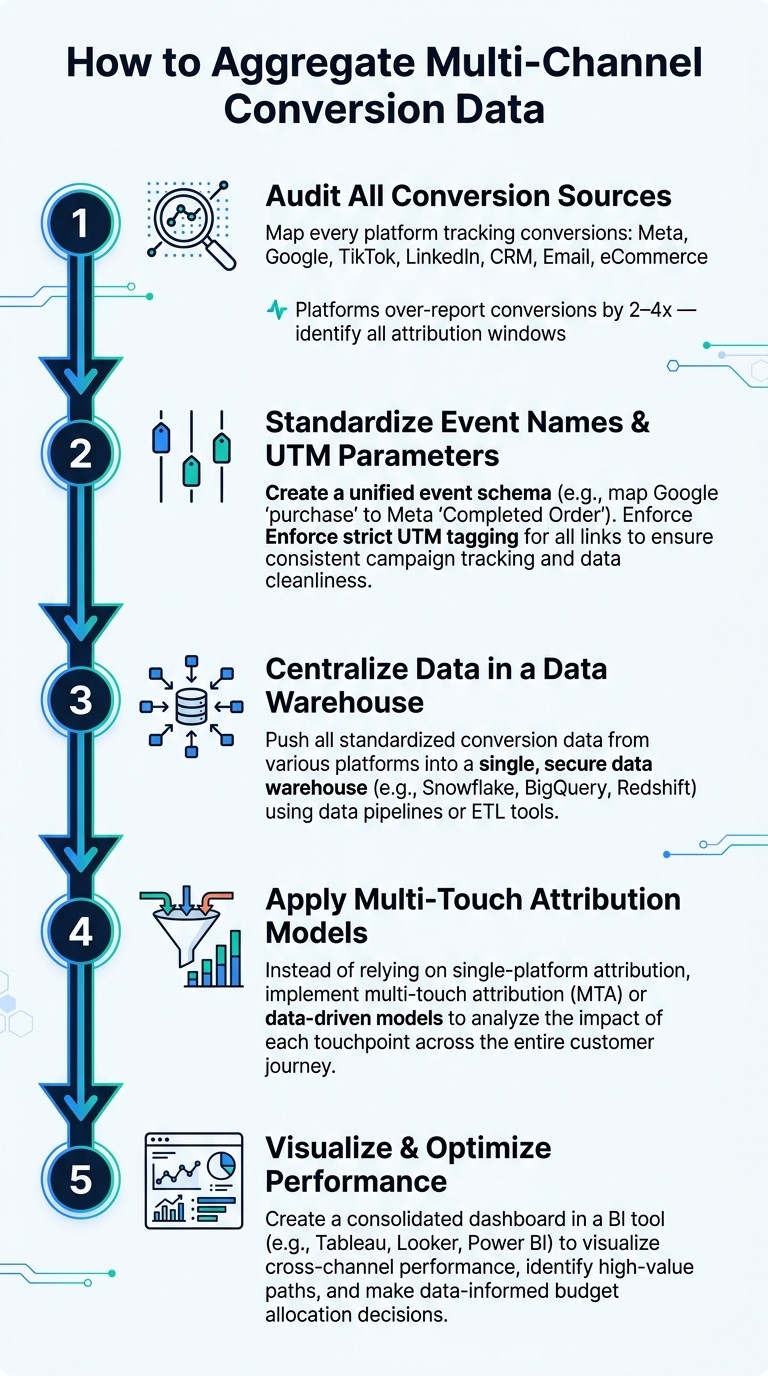
Multi-Channel Conversion Data Aggregation: 5-Step Process
Cross-Channel Attribution Dashboard: Consolidate Performance Data Across Platforms To Improve ROI
Mapping Conversion Sources and Standardizing Tracking
Before combining your data, it's critical to identify all your conversion sources. Skipping this step can lead to mismatched or inaccurate data.
Audit Your Conversion Sources
Start by creating a list of every platform that tracks conversion events. This might include Meta Ads, Google Ads, TikTok, LinkedIn, your CRM (like HubSpot or Salesforce), email tools such as Klaviyo, and your e-commerce platform (like Shopify). For each platform, document what it tracks, how it tracks it, and who manages it.
Pay special attention to attribution windows. For example, Meta typically uses a 7-day click window, while Google’s attribution settings can change depending on the campaign type. These differences can cause the same purchase to be counted multiple times across platforms. To avoid this, compare the conversion data reported by these platforms with a neutral source like GA4. This can help you identify over-counting issues. If you’re unable to track individual users across more than 80% of their journey, it’s often better to rely on aggregated measurement methods rather than platform-specific data.
Once you’ve completed your audit, the next step is to standardize event names and UTM parameters to ensure consistency.
Standardize Event and UTM Naming
Inconsistent naming conventions are a common cause of data aggregation problems.
"Half of multi-channel attribution failures are upstream naming issues. Lock the schema, enforce at trafficking, and the dashboard inherits cleanliness." - Improvado
The solution? Create a unified event schema. This involves mapping platform-specific terms to consistent, universal names. Here's an example:
Platform Field | Unified Field Name |
|---|---|
Google Ads: conversions |
|
Meta: purchase |
|
LinkedIn: lead_gen_form_submissions |
|
Google Ads: cost |
|
Meta: spend |
|
LinkedIn: total_spend |
|
The same approach applies to UTMs. Use a shared spreadsheet or a UTM builder tool to enforce a consistent structure, such as [Channel]_[Campaign Type]_[Audience]_[Quarter]_[Variant]. This prevents inconsistencies like LinkedIn_Q1 and LI-Q1-2026 from creating fragmented data in your reports.
To avoid errors, set up validation alerts to catch campaigns with incorrectly formatted UTMs before they go live. This ensures bad data never makes it to your aggregation layer.
Choosing and Setting Up a Single Source of Truth
Once you've finalized your naming conventions and UTM structures, the next step is selecting a single system to house your unified data. This system serves as your single source of truth (SSOT) - a central hub that consolidates data from all channels, providing a consistent and comprehensive view of performance. With this unified perspective, you can streamline platform integration and ensure accurate attribution.
Selecting an Aggregation Tool
Now that you’ve established a unified schema, choosing between Meta ads attribution vs. third-party tools depends on factors like team size, budget, and how you intend to use the data. If your brand runs ads across multiple platforms, prioritize tools with robust API integrations. Make sure the tool supports platforms like Google Ads, Meta, LinkedIn, TikTok, and any others in your marketing stack.
In addition to API connectors, look for features like data blending, real-time updates, and data warehouse export capabilities. These are especially important if your team relies on tools like BigQuery, Snowflake, or Redshift for advanced analytics.
Tool Type | Examples | Best For |
|---|---|---|
Agency Dashboards | AgencyAnalytics ($79/mo), DashThis ($49/mo) | Agencies needing white-labeling and quick client reporting |
Data Hub / ETL | Funnel.io ($1,000/mo), Supermetrics ($39/mo per connector) | Teams with BI tools needing clean data pipelines |
Enterprise Platform | Improvado ($2,000+/mo), TapClicks ($1,500+/mo) | Large organizations requiring data governance |
Connecting Platforms and Data Sources
For reliable data, always use direct API integrations to connect platforms. Manual exports are prone to errors and delays, which can compromise the integrity of your reporting system.
When connecting platforms, map their native fields to your unified schema as early as possible. A well-organized mapping process at this stage minimizes the need for cleanup later on.
Setting Attribution and Deduplication Rules
After mapping your data accurately, the next step is managing attribution and avoiding double-counting conversions. This is a common challenge since ad platforms often overstate their contributions to conversions. To identify discrepancies, compare Meta ads vs. Google Ads multi-channel attribution by checking platform-reported conversions against GA4 data, which can help you calculate an inflation factor.
To prevent double-counting, designate a neutral source - GA4 is a popular choice - as the definitive record for conversion counts. Then, select an attribution model that aligns with your tracking setup and business goals:
Attribution Model | Best For | Limitation |
|---|---|---|
Last Click | High-intent search campaigns | Undervalues top-of-funnel awareness |
First Click | Brand awareness measurement | Undervalues the final conversion channel |
Linear | Even credit across all touchpoints | Ignores differences in touchpoint influence |
Time Decay | Short sales cycles | Undervalues early awareness touchpoints |
Data-Driven | Accounts with 50+ conversions/month | Requires a large volume of data |
True causal measurement | Complex setup; requires A/B testing |
For accounts generating at least 50 conversions per month, Data-Driven Attribution (DDA) is a strong choice. It uses machine learning to distribute credit based on each channel's actual contribution to conversion probability, rather than relying on fixed rules. If your account has fewer conversions, linear attribution is a good starting point. It ensures no single channel is over-credited while you work toward gathering more data.
Setting Up Server-Side and Cross-Channel Event Tracking
Once you’ve mapped out your custom attribution models and data sources, the next step is ensuring the conversion signals you collect are accurate and comprehensive. Browser pixels alone can miss a significant portion of user journeys - up to 42–65%. That’s where server-side tracking comes in.
Deploy Server-Side Tracking
Server-side tracking sends conversion events directly from your web server to ad platforms, bypassing ad blockers, strict browser privacy settings, and iOS App Tracking Transparency (ATT) restrictions. A popular example of this setup is the Meta Conversions API (CAPI).
Most teams use server-side tracking alongside browser pixels. To avoid counting the same conversion multiple times, assign unique Event IDs to both the pixel payload and the CAPI payload for the same event. If you’re using Google Tag Manager, fire your attribution pixel first and delay triggering native pixels (like Meta or TikTok) by 200ms to prevent race conditions.
"Server-side tracking resists iOS ATT and cookie deprecation better than pixel-based competitors." - Improvado
Normalize Identifiers Across Channels
After implementing server-side tracking, the next step is aligning identifiers to ensure seamless data integration across channels. Different ad platforms rely on different identifiers, so consistency is key to linking user sessions, clicks, and conversions.
Identifier Type | Examples | Use Case |
|---|---|---|
Deterministic | Hashed email, phone number, User ID | High-accuracy cross-device matching |
Click IDs | fbclid, gclid, ttclid | Directly ties an ad click to a session |
Probabilistic | IP address, device fingerprint | Backup when deterministic data isn’t available |
Whenever possible, prioritize deterministic identifiers like hashed emails or User IDs for their accuracy. Only invest in probabilistic methods if cross-device conversions make up more than 30% of your total volume.
Send Enriched Conversion Data Back to Ad Platforms
To close the loop, push enriched conversion data back to the ad platforms you’re using. This step reinforces the reliability of your aggregated data and helps platforms optimize for outcomes that align with your business goals. By sending detailed information - like actual conversion values, transaction revenue, or CRM-validated lead quality - you enable ad algorithms to focus on meaningful metrics instead of surface-level proxies .
For Meta campaigns, the quality of your server-side data is just as important as the quantity. Meta’s Event Match Quality scores provide insight into how well your data is performing, helping you recover lost attribution. Scores below 6.0/10 suggest significant data loss, while scores above 8.0 indicate strong performance. To boost your score, include hashed first-party data - such as email, name, and location - with every conversion event sent through CAPI.
Timing is another crucial factor. Avoid making budget decisions based on same-day ROAS data from Meta since conversion data can take up to 72 hours to fully process due to modeling and delays. Build this delay into your workflow to ensure you’re making decisions based on reliable data. By feeding enriched data back into your system, you lay the groundwork for better campaign optimization and unified reporting.
Building and Using Multi-Channel Conversion Reports
Designing Cross-Channel Dashboards
Once your data system is unified, the next step is turning that enriched server-side data into actionable insights with customized dashboards for different audiences.
A helpful method here is the three-layer metric strategy. This involves tracking three key types of metrics in a single view: acquisition (e.g., CPA, CPC, CPM), engagement (e.g., bounce rate, time on site), and revenue (e.g., ROAS, CAC, CLV). Then, tailor the dashboard layout based on the audience. For instance:
Executives: High-level trends, total revenue contribution, and budget pacing (actual vs. planned).
Analysts: Campaign-level breakdowns and attribution model comparisons.
Specialists: Creative performance, audience segmentation, and keyword-level details.
"One dataset, three layouts. Don't ship the analyst view to the CEO - and don't ship the exec view to the ops team." - Improvado
It's also important to address inflated data from ad platforms, which often over-report by 2–4x because each platform claims credit for overlapping touchpoints. Use a neutral data source to correct these discrepancies and ensure your dashboards reflect accurate, unbiased metrics. Once you've tailored the dashboards and verified the data, set up automated refreshes to keep everything current.
Automating Data Refresh and Quality Checks
Marketers spend a surprising amount of time - 4–6 hours weekly - compiling reports, while analysts devote 40–60% of their time to data collection. Automating these processes can save significant time and resources.
Set refresh rates based on the needs of the users. For instance, daily optimizations may require hourly updates, while executive reviews might only need weekly updates. Always include a "last updated" timestamp on dashboards so users know how fresh the data is. This is especially critical since update speeds vary - Google Ads refreshes hourly, while some affiliate networks may take up to 48 hours.
For quality control, implement real-time alerts to flag issues like CPA exceeding thresholds, daily spend surging by more than 20%, or impressions dropping to zero. Additionally, dedicate 15 minutes every Monday to verify that key conversion events (e.g., Purchase, Lead) are firing correctly and that Event Match Quality scores remain above 6.0. Conduct a weekly reconciliation to compare ad platform-reported revenue with Shopify or your payment processor, helping you gauge how much each platform is inflating its numbers.
Using Aggregated Data to Optimize Campaigns
Once your dashboards are operational and data quality is ensured, it’s time to use these insights to fine-tune your campaigns. Unified data is only valuable if it drives actionable changes. A tiered review cadence can help maintain focus:
Daily: Monitor delivery health metrics like CPM, Frequency, and CTR.
Every three days: Review conversion efficiency (e.g., CPA, ROAS) after allowing for a 72-hour data delay.
Weekly: Analyze creative diagnostics, such as hook rate, hold rate, and completion rate, against Meta ads benchmarks.
When reallocating budgets, always rely on neutral data rather than inflated platform metrics. For example, if a platform reports 100 conversions but your neutral source shows only 40, the platform's data inflation factor is 2.5. Use the neutral source for budget decisions to avoid over-allocating funds. Teams that adopt this approach often see a 15–25% boost in marketing efficiency through smarter budget allocation.
For Meta campaigns, tools like AdAmigo.ai can simplify optimization. By leveraging your unified conversion data, AdAmigo automates tasks like scaling high-performing ads, pausing underperformers, and testing new creatives. It can operate autonomously or seek your approval before making changes. Since its effectiveness hinges on clean, reliable data, this tool becomes even more valuable once your aggregated data is in top shape.
Conclusion and Next Steps
This guide has walked you through the key steps to bring conversion tracking together across multiple channels. Pulling in data from various sources and keeping it aligned is an ongoing effort that demands regular upkeep. The steps outlined - auditing your tracking setup, standardizing naming conventions, establishing a neutral source of truth, implementing server-side tracking, and creating targeted dashboards - are designed to build on one another for a cohesive system.
The payoff? It’s worth it. Brands that adopt advanced multi-channel attribution see a 28% boost in conversion rates and save up to 32% on marketing costs. Teams that consolidate data into a single dashboard report cutting their reporting time by over 80%, reclaiming hours once spent wrestling with spreadsheets and manual processes.
Streamlining your data doesn’t just save time - it improves the quality of your decisions. To keep your system running smoothly, establish a regular review schedule. For example, conduct daily checks on delivery health, review conversion efficiency every few days, and perform weekly creative and CRM reconciliations. These habits ensure your data remains accurate and actionable, steering clear of inflated or misleading platform metrics.
To get started, connect just two or three platforms using a neutral tool like GA4, and enforce consistent UTM naming conventions. From there, integrate server-side tracking, automate your data updates, and gradually expand your dashboard. The more you maintain and refine this system, the more value it delivers. Start today, and take the first step toward a unified, clear view of your conversion data.
FAQs
What should I use as my single source of truth for conversions?
To get a complete view of your conversions, use a unified data system or dashboard. This lets you pull data from all your channels into one place, making performance tracking much more accurate. Plus, it saves you from the hassle of manually piecing everything together. Tools designed to combine multi-channel data can make reporting easier and give you a better understanding of your overall performance.
How do I deduplicate conversions counted by multiple ad platforms?
To avoid counting the same conversion multiple times across different ad platforms, you can assign a unique eventId to every conversion. Share this eventId with all platforms you're using, such as Facebook, Google, and LinkedIn. When these platforms detect duplicate events with the same eventId, they ignore the extras and only count one instance.
Some platforms, like LinkedIn, also provide built-in options to set up deduplication rules. These rules simplify the process, ensuring better attribution accuracy and preventing inflated conversion numbers.
When should I switch to data-driven attribution?
Switch to data-driven attribution if you're looking for a clearer and more precise understanding of how your marketing efforts perform across different channels. This approach becomes even more critical as privacy updates and data limitations make platform-based models less dependable - a trend that's only growing in importance as we move further into 2026. By using data-driven attribution, you can navigate these challenges and gain better insights into how your campaigns drive conversions.