
Meta Ads vs. Google Ads: Multi-Channel Attribution
Both platforms overstate conversions—use GA4, correction factors, and geo-holdouts to reveal true multi-channel attribution.
When comparing Meta Ads and Google Ads for multi-channel attribution, the key takeaway is this: both platforms inflate their reported conversions, and neither gives you the full picture. Meta focuses on creating interest, while Google captures intent, but their siloed systems lead to overlapping credit and inflated metrics.
Key Points:
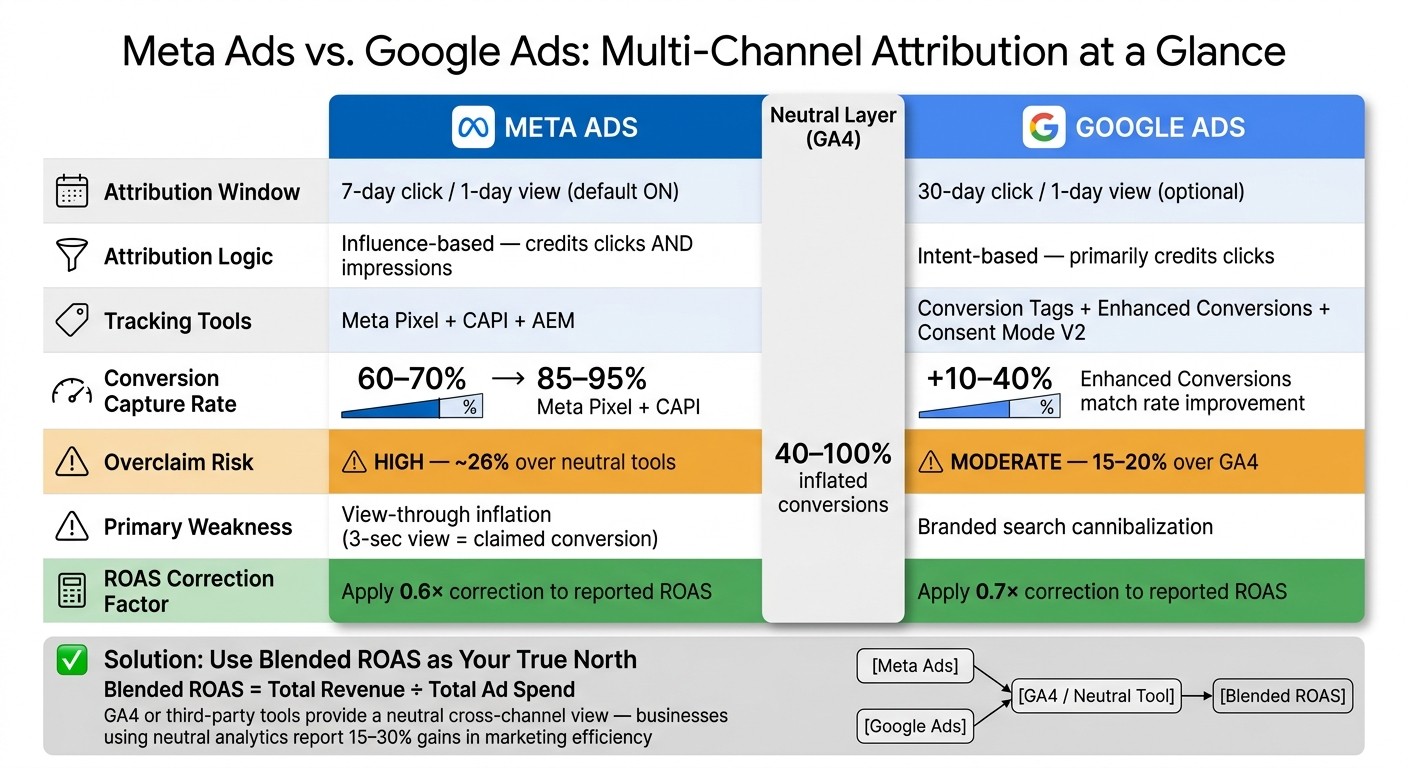
Meta Ads: Uses a 7-day click and 1-day view attribution window. Relies on tools like Meta Pixel and Conversions API (CAPI). Reports ~26% more conversions than neutral tools due to view-through attribution and modeled data.
Google Ads: Defaults to a 30-day click window with optional 1-day view-through. Uses Conversion Tags, Enhanced Conversions, and Consent Mode V2. Over-reports conversions by 15–20%, often attributing credit to branded searches.
The Problem: Both platforms claim full credit for shared conversions, leading to inflated reports by 40–100%.
Solution: Use GA4 integration or third-party tools as a neutral layer for cross-channel analysis. Adjust platform-reported ROAS with correction factors (e.g., 0.6× for Meta, 0.7× for Google) to align closer to actual performance.
Quick Comparison:
Feature | Meta Ads | Google Ads |
|---|---|---|
Default Click Window | 7 days | 30 days |
View-Through Credit | 1-day view (default on) | 1-day view (optional) |
Primary Tools | Meta Pixel + CAPI + AEM | Conversion Tags + Enhanced Conversions |
Overclaim Risk | High (~26% over neutral tools) | Moderate (15–20% over GA4) |
Primary Weakness | Inflated view-through conversions | Branded search cannibalization |
To allocate budgets effectively, rely on blended ROAS (total revenue ÷ total ad spend) and neutral analytics like GA4. Platforms like Meta and Google are great for optimizing within their ecosystems, but for broader decisions, neutral tools provide a clearer view of what’s driving sales.
Meta Ads vs. Google Ads: Attribution Windows, Overclaim Rates & Correction Factors
Meta Ads Multi-Channel Attribution

Tracking and Attribution in Meta Ads
Meta relies on two key tools for tracking: the Meta Pixel and the Conversions API (CAPI). The Pixel works on the browser side, capturing user actions like clicks and page views. On the other hand, CAPI operates on the server side, sending conversion data directly from your server. This bypasses common barriers like ad blockers and cookie restrictions. By 2026, using only the Pixel captures about 60–70% of conversions, but adding CAPI boosts that number to 85–95%.
"Without CAPI, you lose crucial conversion data."
For iOS users, especially after the iOS 14.5 update, Meta uses Aggregated Event Measurement (AEM). This system limits tracking to eight prioritized conversion events per domain, making it vital to prioritize events like "Purchase" to ensure critical actions are captured.
Meta’s default attribution window is set to 7 days for clicks and 1 day for views. This means Meta can claim a conversion if someone views an ad for as little as 3 seconds and makes a purchase within 24 hours - even without clicking the ad. This framework influences how Meta credits conversions and shapes reported performance.
How Meta Attribution Favors Its Own Ecosystem
Meta’s attribution model is influence-based, not last-click. It assigns credit for any conversion that follows a Meta touchpoint, whether it’s a click or just an impression. However, because Meta can only track its own ecosystem, it doesn’t account for other channels like Google, email, or organic search. For instance, if someone sees a Meta ad on Monday, clicks on a Google Shopping link on Friday, and makes a purchase, Meta may still claim credit if the ad impression occurred within its 1-day view window.
Meta also connects actions across devices. For example, 65% of conversions start on one device (like a smartphone) and finish on another (like a desktop). When direct tracking isn’t possible - such as with users who opt out on iOS - Meta uses machine learning to estimate conversions through modeled data.
These practices can lead to inflated performance metrics, as outlined in the next section.
How Meta Attribution Affects Reporting
Meta’s tracking and influence-based attribution often lead to inflated Return on Ad Spend (ROAS) figures. On average, Meta overstates ROAS by about 28% across various industries. Take The Littl, for example: their campaigns showed a Meta-reported ROAS of 3.8×. However, when cross-referenced with integrated data, the actual blended ROAS was just 1.9× - a 60% overstatement, largely due to iOS modeling inaccuracies. By adjusting their ad spend by 15% based on these findings, they saw a notable improvement in blended ROAS within two weeks.
Here’s a quick summary of Meta's key attribution settings:
Feature | Meta Ads Attribution |
|---|---|
Default Window | 7-day click, 1-day view |
Tracking Method | Meta Pixel + Conversions API (CAPI) |
iOS Protocol | Aggregated Event Measurement (AEM) |
Event Limit | 8 prioritized events per domain |
Credit Logic | Last Meta touch (click or view) |
Data Type | Observed + modeled (statistical) |
To get a clearer picture of performance, it’s helpful to apply a correction factor of 0.6× to 0.8× to Meta’s reported ROAS. This approach ensures a more realistic evaluation of cross-channel effectiveness. Meta’s dashboard is best used for internal platform insights rather than as a definitive measure of overall performance.
Google Ads Multi-Channel Attribution
Tracking and Attribution in Google Ads
Google Ads uses three key tools to track and measure user actions:
Conversion Tags: These record specific actions like purchases or form submissions. Implementing custom conversion reporting ensures these tags capture the most valuable business outcomes.
Enhanced Conversions: By sending hashed first-party data, this feature can improve match rates by 10–40%.
Consent Mode V2: This tool estimates user behavior through statistical modeling when cookies are declined.
As of July 2023, Google Ads defaults to Data-Driven Attribution (DDA). This machine learning model assigns credit across Google-owned touchpoints, such as Search, Shopping, and YouTube. The attribution window defaults to 30 days for clicks (adjustable up to 90 days) and includes an optional 1-day view-through window. These tools and settings form the backbone of Google’s attribution system, offering both benefits and limitations.
Strengths and Weaknesses of Google Attribution
Google’s 30-day click attribution window works well for longer sales cycles, especially for high-consideration products. Search campaigns often see conversion rates between 3–8% and a return on ad spend (ROAS) ranging from 300% to 800%.
However, there are notable drawbacks to consider:
Branded Search Cannibalization: When users already intent on purchasing search for a brand name, Google Ads often claims full credit for the conversion - even if the user would have converted organically.
Data-Driven Attribution Limitations: For DDA to work effectively, an account needs at least 600 conversions per month. Below this threshold, the results can become inconsistent or "noisy".
Over-Attribution: Enhanced Conversions and Consent Mode V2 can inflate conversion numbers by 15–20% when modeled data is used, as noted by EasyInsights.
"Google Ads over-attributes by 15–20% when Enhanced Conversions or Consent Mode V2 kicks in for modeled conversions." - EasyInsights
These factors can significantly affect how conversions are tracked and reported.
How Google Attribution Affects Reporting
Google Ads employs a platform-centric approach to attribution. If a user clicks on a Google ad at any point before converting, the platform assigns full credit - even for branded searches that stem from organic interest. This siloed reporting means Google Ads cannot account for touchpoints from other channels like Meta, email, or organic search.
This results in Google Ads often reporting more conversions than GA4, which distributes credit proportionally across all channels. A variance of 20–40% between Google Ads and GA4 is considered typical as of 2026.
Feature | Google Ads Attribution |
|---|---|
Default Model | Data-Driven Attribution (DDA) |
Default Window | 30-day click; 1-day view (optional) |
Tracking Tools | Conversion Tags, Enhanced Conversions, Consent Mode V2 |
Modeled Data | High reliance on modeling for privacy-restricted users |
Primary Weakness | Attributes full credit to branded searches even when organic interest is involved |
For campaign optimization and bidding, relying on Google Ads data is recommended, as it aligns with the platform’s machine learning algorithms. However, for broader, cross-channel budget decisions, GA4 or third-party tools provide a more balanced perspective. As Holly Henderson, Co-Founder of mbuzz, explains: "For cross-channel decisions, GA4 is less biased. For Google Ads optimization, use Google Ads data."
Comparing and Combining Meta and Google Attribution
Meta Ads vs. Google Ads: Side-by-Side Attribution Comparison
Getting accurate attribution across Meta and Google Ads is no easy task. Each platform has its own tracking quirks and biases, which can make it tricky to optimize ad spend. The main difference lies in their approach to intent: Google captures demand by targeting users actively searching for something, while Meta creates demand by sparking interest through discovery. These roles naturally lead to different ways of attributing conversions.
Feature | Meta Ads | Google Ads |
|---|---|---|
Default Click Window | 7 days | 30 days |
View-Through Credit | 1-day view (default on) | 1-day view (optional) |
Attribution Logic | Influence-based (counts views) | Intent-based (clicks only) |
Tracking Method | Pixel + CAPI + AEM | Conversion Tags + Enhanced Conversions |
Overclaim Risk | High - ~26% over neutral tools | Moderate - 15–20% over GA4 |
Primary Weakness | View-through inflation | Branded search cannibalization |
One major issue is that neither platform can track each other's activity. This often results in "The Sum Problem", where both platforms double-count conversions. The result? Inflated performance reports that can show up to 40–100% more conversions than actual sales.
"If you set budget by platform-reported ROAS, you're overspending. Every channel looks profitable when each one over-reports its share." - mbuzz
To address these discrepancies, many advertisers setup Meta conversions with GA4 as a neutral, third-party measurement layer.
Using GA4 as a Neutral Attribution Layer
GA4 offers a way to see the bigger picture. Unlike Meta or Google, it pulls together data from multiple sources - Meta, Google, email, and organic search - using consistent attribution logic. This makes it a valuable tool for cross-channel analysis.
However, GA4 isn't perfect. It underreports conversions by 18–35% when cookies are blocked. Think of it as a conservative baseline rather than the absolute truth. For tasks like adjusting bids or testing creatives, stick with the data from each platform. But for deciding how to allocate your budget across channels, GA4 provides a less biased perspective.
To make GA4 more reliable:
Use standardized UTM parameters across all campaigns. For example:
utm_source=facebook&utm_medium=paid_social&utm_campaign={{campaign.name}}.Change Meta's reporting settings to 7-day click only to better match GA4's click-based tracking.
Implement server-side tracking. Relying on the Meta Pixel alone captures only 60–70% of conversions. Adding the Conversions API (CAPI) increases match rates to 85–95%.
With these steps, GA4 becomes a stronger tool for understanding how different channels contribute to your overall performance.
How to Analyze the Multi-Channel Conversion Funnel
Meta and Google play different roles in the customer journey. Meta often drives awareness at the top of the funnel, while Google captures intent at the bottom. But if you only look at each platform's reported numbers, this dynamic is easy to miss.
To adjust for overcounting, apply discount factors - 0.70 for Google Ads and 0.60 for Meta Ads. This helps bring their reported conversions closer to reality for cross-channel analysis. For example, in October 2025, a mid-sized e-commerce brand analyzed by ThoughtMetric recorded $586,849.54 in revenue from 3,566 orders. Of those, 66 orders ($10,546.73 in revenue) involved both Meta and Google touchpoints. Without multi-touch attribution, the platforms would have reported $21,093.46 for those shared sales - double the actual amount.
To truly understand which channels drive growth, run quarterly geo-holdout tests. Pause one channel in a specific region while keeping it active elsewhere, then compare conversion rates. This approach measures the real incremental impact of each channel, cutting through inflated platform claims. For budgeting, focus on blended ROAS - total revenue divided by total ad spend - for an unbiased view of performance.
The Dark Side of Attribution in Meta & Google Ads: What You’re Missing
Conclusion: Meta Ads vs. Google Ads in Multi-Channel Attribution
Meta and Google each play distinct roles in advertising. Google focuses on capturing demand - it engages users who are actively searching and ready to take action. Meta, on the other hand, creates demand - introducing products to people who may not have been searching in the first place. These differences reflect their unique positions within the marketing funnel. However, their independent tracking methods often lead to overlapping credit, inflating reported revenue figures by anywhere from 40% to 100%.
This discrepancy highlights the need for different strategies when analyzing performance on individual platforms versus across multiple channels. As EcomAIOS explains:
"Platform-reported ROAS is a marketing number. Blended ROAS is a finance number. Your job as a founder is to run the business on finance numbers."
Platform dashboards are excellent for tasks like optimizing bids, testing creatives, and managing audiences within their respective ecosystems. But when it comes to making budget decisions, rely on neutral data sources. Your backend systems, like Shopify, or third-party attribution tools can provide a more accurate picture of what’s driving revenue. Neutral analytics offer a clearer view of multi-channel performance, and businesses that leverage these insights have reported 15–30% improvements in marketing efficiency.
Ultimately, Meta and Google complement one another. Meta helps build interest and awareness, while Google is often the final step in converting that interest into action. By treating them as part of a portfolio and using blended ROAS as a guide, businesses can allocate budgets more effectively and grow profitably.
FAQs
How do I stop Meta and Google from double-counting sales?
To prevent double-counting sales between Meta and Google, it's crucial to establish a solid cross-channel attribution strategy. Start by using a neutral third-party attribution tool to resolve any inconsistencies that arise from the platforms' varying attribution models and timeframes. Align key settings, such as focusing on primary conversion events and synchronizing attribution windows (like 7-day click or 1-day view), to minimize overlaps. Remember, platform-specific data should be viewed as directional insights, while unified attribution provides a clearer and more accurate picture of your actual sales performance.
Which ROAS number should I trust for budget decisions?
The ROAS (Return on Ad Spend) you rely on varies based on the attribution model and measurement window each platform uses. For instance, Google Ads generally operates with a 30-day click window, while Meta Ads applies a 7-day click and 1-day view window. This means the same conversions might be credited differently depending on the platform.
To make smarter budget decisions, it's better to use a neutral, cross-platform attribution system. Platform-specific metrics often differ significantly, which can lead to inconsistent insights.
What’s the best way to measure true incrementality?
Using a neutral third-party attribution tool is the best way to gauge true incrementality. These tools help address overlapping touchpoints across different channels and tackle inconsistencies that arise from varying attribution models used by platforms like Google and Meta. By relying on independent tools, you get a more accurate picture of how each channel drives conversions, allowing you to measure the real impact of your campaigns instead of depending on potentially skewed platform data.