
Tracking Trends in Meta Ad Creatives
Track CTR, CPM, ROAS and frequency to spot creative fatigue; standardize naming, schedule refreshes, and use AI to automate creative insights.
If you're running ads on Meta, keeping track of long-term trends is crucial for success. Focusing only on short-term metrics like CTR (Click-Through Rate) or ROAS (Return on Ad Spend) can cause you to miss patterns like audience saturation or declining ad performance. Meta’s algorithm now prioritizes creative performance over targeting, making it the most critical driver of ad success.
Here’s what you need to know:
Creative quality impacts costs: Strong ads with high engagement can keep CPMs (Cost Per Thousand Impressions) as low as $25, while weaker ads may see CPMs rise above $50.
Key metrics to track: CTR, CPM, ROAS, and frequency help identify performance trends and when ads are losing effectiveness.
Ad fatigue signs: Dropping CTR, rising CPM, and increased frequency (3–5 for prospecting, 5–8 for remarketing) signal it’s time to refresh your ads.
Testing timelines: For sales-focused campaigns, monitor performance over 30–90 days, with regular refreshes every 7–10 days for fast-paced industries.
AI tools like AdAmigo.ai: Automate tracking, identify fatigue early, and suggest new ad variations to keep performance steady.
Meta ads thrive on consistent testing and updates. By monitoring trends, using tools like Meta’s Breakdown by Asset, and leveraging AI, you can maintain high CTRs, low CPMs, and growing ROAS over time.
Understanding Long-Term Creative Performance Trends
Creative Performance Metrics Explained
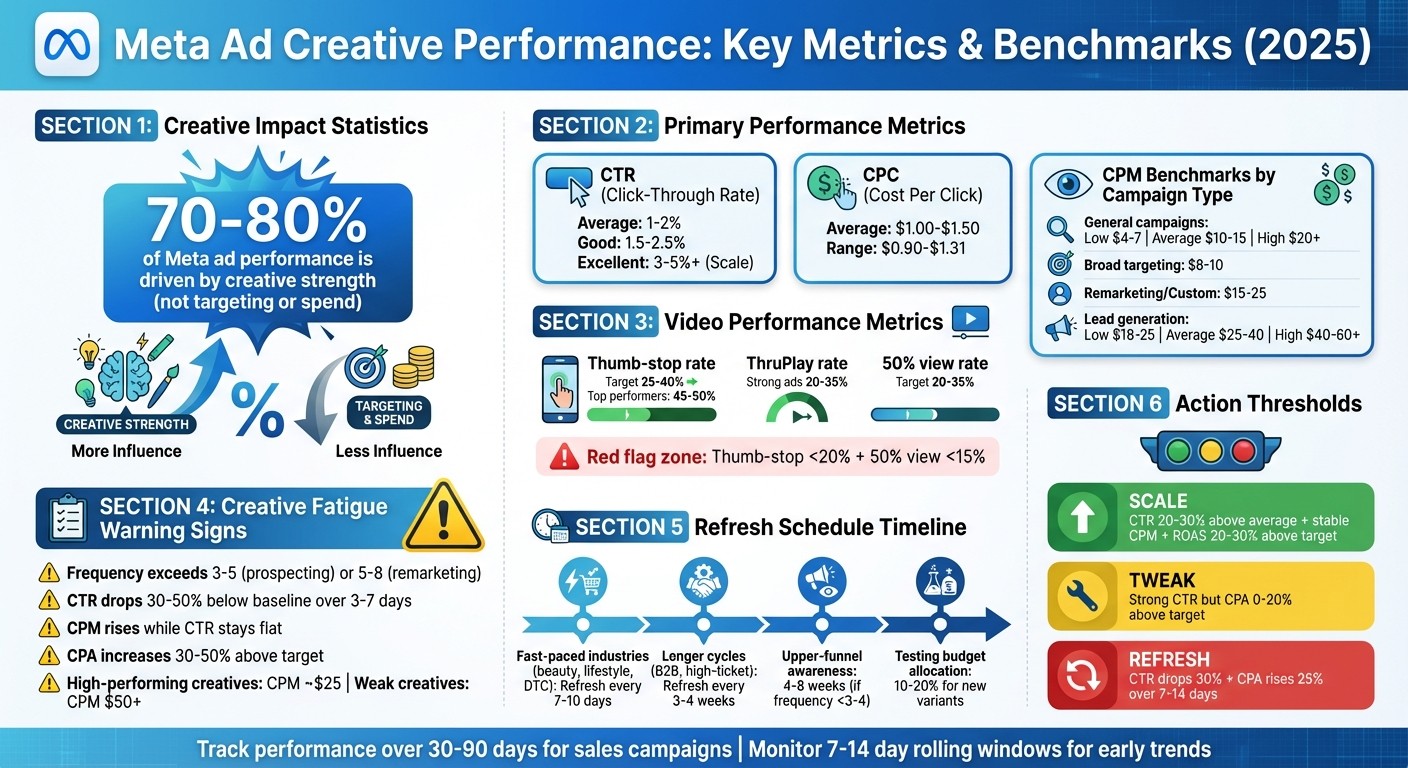
When it comes to Meta ads, creative performance measures how effectively your ad elements - like images, videos, copy, hooks, and formats - drive impressions, clicks, and conversions. This operates independently of your targeting or budget. According to a 2025 analysis by Billo, 70–80% of Meta ad performance is driven by creative strength rather than targeting or spend. That’s a massive departure from the days when micro-targeting was king.
Meta’s algorithm evaluates creative quality through signals like early engagement rates, click-through rate (CTR), post-click behavior, and negative feedback (such as ad hides or reports). High-quality creatives that generate strong engagement and minimal negative feedback are rewarded with better delivery and lower CPMs. These ads tend to maintain higher CTRs, achieve better conversion rates, and sustain performance over longer periods. On the other hand, weaker creatives face rising CPMs and declining delivery over time as Meta deprioritizes them in auctions - even if your targeting and budget remain unchanged. For this reason, tracking CPM, CTR, and ROAS trends over several weeks is vital to understanding how Meta’s quality assessment impacts your campaigns.
What Trend Dimensions to Monitor
To tell the difference between creative fatigue and creative durability, it’s important to focus on a few key metrics. Creative fatigue becomes evident when spend and audience size remain steady, but CTR and ROAS begin to drop while CPM and frequency increase. This typically means your audience has seen the ad too many times. Plotting CTR and ROAS against frequency can help you identify this pattern. Fatigue often sets in when the average frequency exceeds 3–5 for prospecting campaigns or 5–8 for remarketing, depending on your niche.
On the flip side, durable creatives maintain consistent performance even at higher frequencies. These often include evergreen formats like testimonials, how-to demos, or problem-solution narratives. Comparing the lifespans of different creative types - such as user-generated content (UGC) versus studio-produced ads, or promotional versus educational content - can help you design ads that last longer.
Performance also varies significantly across formats and placements. Reels and Stories, for example, tend to generate high engagement and low CPC, especially with short-form, UGC-style videos, making them ideal for top-of-funnel campaigns. Meanwhile, Feeds (both Facebook and Instagram) are more effective for driving purchases or high-value conversions, particularly when using 4:5 vertical assets with clear calls-to-action and product demonstrations. Tracking these differences over time allows you to establish format-specific benchmarks and allocate your budget more effectively.
Recommended Tracking Time Frames
The ideal tracking duration for creatives depends on your campaign goals and buying cycle. For sales and direct-response campaigns, track performance over 30–90 days per creative to gather meaningful insights. Within this period, use 7- and 14-day rolling windows to identify early trends, such as week-over-week ROAS declines. High-paced e-commerce brands, particularly in industries like beauty, often refresh their creatives every 7–10 days while still leveraging 30–60 day data to refine their strategies.
For lead generation campaigns with longer sales cycles, monitor performance over 30-, 60-, and 90-day windows, incorporating down-funnel metrics like lead-to-opportunity or lead-to-sale conversion rates. Meanwhile, brand awareness or reach campaigns benefit from quarterly evaluations (spanning 3 months), focusing on metrics like reach, video views, and CPM instead of short-term ROAS. Long-term tracking also enhances AI tools like AdAmigo.ai by providing richer datasets, enabling them to predict fatigue windows and recommend timely ad refreshes before performance drops. This process is driven by how AI matches creatives to audiences based on real-time engagement signals.
Setting Up Systems to Track Creative Trends
Organizing Ad Accounts for Clear Data
A well-structured ad account is key to tracking creative trends effectively. Start by segmenting campaigns by aligning goals with objectives and funnel stages, like PROSPECTING_Adv+, RETARGETING_30D, or LOYALTY_180D. This approach ensures you're comparing creative performance in similar contexts over time, avoiding the confusion of mixing cold traffic with warm audiences, which can lead to inconsistent data.
Adopt a hierarchical naming system, such as OBJ_CONV | GEO_US | AUD_LLA2% Purchasers | PLC_FEED+REELS | CREATIVE_Hook-UGC-Test1. This format makes it easier to filter by creative concept, placement, or audience. When testing new creatives, stick to 3–6 variants per ad set and keep variables like audience, placements, and optimization consistent. This way, any performance changes can be confidently attributed to the creative itself. Tag each creative with a concept ID and version number (e.g., V1, V2, V3) to track results across iterations.
Separate your campaigns into two categories: "Evergreen" and "Testing". When a creative demonstrates strong performance - like achieving a ROAS of 3.0 or higher over 7–14 days - it should graduate to the evergreen campaign with an appropriate tag. This system keeps your data clean and avoids clutter from underperforming creatives. Avoid making mid-test changes, such as merging ad sets or editing live creatives. Instead, duplicate the creative as a new ad with an updated version number to preserve historical data and prevent learning-phase resets.
Once your account structure is organized, you can dive into Meta's built-in tools to analyze and validate your data with Google Analytics.
Using Meta's Built-In Tracking Tools
Meta Ads Manager provides several underused features that can make tracking creative trends much easier. For example, the Breakdown by Asset view (located under Breakdown → By Asset → Image, video and slideshow) lets you pinpoint which specific visuals - thumbnails, videos, or images - are driving conversions and ROAS trends. You can also track custom conversions to see how specific creative elements influence unique business actions. This doesn’t require any changes to your account structure. Pair this with the Breakdown by Delivery → Placement option to see how creatives perform across Feeds, Reels, and Stories. This can help identify early signs of fatigue, like a drop in CTR for Stories while Feed performance remains steady.
Create saved reports focused on stable structures, such as prospecting campaigns or UGC-style creatives. Include essential metrics like CTR, CPC, CPA, ROAS, CPM, thumb-stop ratio, and outbound CTR. Use filters based on your naming conventions - like searching for ad names containing HOOK_TEST - to group similar concepts. Compare performance across time ranges, such as the last 30 days versus the previous 30 days. Schedule these reports to be delivered weekly, complete with visual highlights for metric changes, making it easy to spot trends at a glance.
For more precise validation, leverage Meta Experiments (A/B tests). These allow you to isolate creative concepts as the sole variable while keeping factors like budget, audience, and placements constant. Run tests for at least 7–14 days with enough spend to achieve statistical significance. Once you identify a winning concept, tag it as a "baseline" for future iterations. Periodically re-run these experiments to see if updated creative elements, like more native-looking UGC or refreshed value propositions, can deliver sustained improvements rather than just short-term gains.
After mastering Meta’s tools, you can introduce advanced AI solutions to further streamline and optimize your creative tracking.
Adding AI and External Analytics Tools
As your campaigns grow, manual tracking becomes increasingly time-consuming. This is where AI tools like AdAmigo.ai come in handy. These tools can automatically scan your Meta account, tagging creatives by brand style, hook type, and performance. They provide insights into your top-performing creatives and flag those that are losing effectiveness, offering a clear view of trends without the need for manual spreadsheets.
An AI agent links creative metrics to your KPIs - such as achieving a ROAS of 3× while scaling spend by 30% - and generates a prioritized to-do list. It can recommend which creatives to scale, pause, or iterate. Over time, the AI learns which creative elements (e.g., UGC vs. polished content, short vs. long formats, or specific CTAs) consistently lead to better performance. Teams can review a daily feed of AI-recommended creatives, approve or tweak them, and use bulk launch best practices to deploy multiple variants while maintaining your naming conventions and UTM structure.
For a more hands-on approach, build a custom dashboard that consolidates key data points, such as Creative ID, concept, version, format, hook, and spend. Include weekly aggregated performance metrics like ROAS, CTR, and CPA. Simple line and bar charts can help visualize how each creative concept performs over time, making it easier to identify trends - like which styles maintain strong results and which fade quickly.
How to Analyze Facebook Ads Creative
Key Metrics and Benchmarks for Creative Trend Analysis
Meta Ad Creative Performance Benchmarks and Fatigue Indicators
Primary Metrics to Track Over Time
Keeping an eye on the right creative metrics can help you pinpoint what’s working and catch signs of fatigue early. Start with CTR (click-through rate) - both link CTR and all-click CTR - as it’s a clear indicator of whether your creative grabs attention and prompts action. Pair this with CPC and CPM: if CPM rises but CTR stays flat, it might mean your creative is losing its edge or the market is becoming saturated.
For campaigns focused on conversions, metrics like conversion rate (CVR), cost per acquisition (CPA), and ROAS (return on ad spend) are critical for gauging whether clicks are translating into revenue. Don’t overlook frequency and reach, as they can signal creative fatigue. For instance, if frequency exceeds 3–5 while CTR drops week over week, it’s likely time for a creative refresh. Engagement metrics like saves and shares can also provide insight into how long your creative remains effective.
For video campaigns, thumb-stop rate (the percentage of impressions with at least three seconds of viewing) is a key metric. Aim for 25–40%, with top-performing videos hitting 45–50% for warm audiences. Other important metrics include the ThruPlay rate (percentage of viewers who watch to completion or at least 15 seconds) and the 50% view rate. Strong direct-response video ads typically achieve 20–35% on the latter. If your thumb-stop rate is below 20% and your 50% view rate is under 15%, it’s probably time to rethink the opening moments of your video.
Once you’ve identified these metrics, use benchmark data to compare Meta Lead Forms and landing pages to see how your performance stacks up within U.S. campaigns.
US Industry Benchmarks for Creative Performance
Comparing your results to U.S. industry standards can help you fine-tune your targets. For Meta campaigns in 2025, the average CTR generally falls between 1–2%, with fashion ads averaging 2.64% and electronics at around 1.91%. A solid CTR typically lands in the 1.5–2.5% range, while standout creatives can hit 3–5% or higher.
The average CPC usually ranges between $1.00 and $1.50, though it can fluctuate slightly month to month, from $0.90 to $1.31, depending on competition.
CPM benchmarks vary widely based on your campaign’s goals and audience. For general campaigns (like traffic, engagement, or reach), CPMs might range from $4–$7 at the low end, average $10–$15, and reach $20+ on the higher end. Broad targeting often results in CPMs of $8–$10, while more specific audiences, like remarketing or custom segments, can push CPMs to $15–$25. Lead-generation campaigns targeting website conversions tend to have even higher costs: expect CPMs starting at $18–$25, averaging $25–$40, and peaking at $40–$60 (or even $80+ in competitive spaces like legal or finance).
High-performing lead-generation creatives with conversion rates above 10–15% usually maintain CPMs around $25, while underperforming ones might see CPMs climb to $50+ as Meta struggles to find effective placements. If your CTR and CVR are improving while CPM stays flat or drops, it’s a sign that your creative is driving genuine efficiency gains rather than just benefiting from audience shifts.
These benchmarks can help you set thresholds and alerts in your trend dashboard, ensuring you stay on top of your creative performance.
Building a Simple Trend Dashboard
A well-organized dashboard makes it easier to monitor key metrics. At a minimum, track spend, impressions, reach, frequency, CTR, CPC, CPM, CPA, and ROAS by creative ID on a daily, weekly, and monthly basis. To spot early engagement trends, consider adding metrics like saves or video hold rate. For video campaigns, include 3-second view rate, ThruPlay rate, and completion rate.
Set clear thresholds to guide decision-making without constant manual checks. For instance, pause or stop a creative if its CTR drops 30–50% below your account baseline over 3–7 days with significant spend, or if CPA rises 30–50% above your target in the same period. Similarly, if frequency exceeds 3–5 while CTR declines - especially in smaller audiences - it’s a sign of creative fatigue. On the flip side, scale or replicate assets when CTR is 20–30% above your account average and CPC/CPM remain stable or drop, or when ROAS consistently exceeds your target by 20–30% over 3–7 days with meaningful spend.
Tools like AdAmigo.ai can automate much of this work by continuously tracking creative performance and flagging ads for scaling, pausing, or iteration. The platform integrates creative metrics with your KPIs - such as achieving a 3× ROAS while increasing spend by 30% - and generates a prioritized daily to-do list. Over time, it learns which creative elements (e.g., user-generated content vs. polished designs, short vs. long formats, or specific calls to action) yield the best results, reducing the need for manual analysis.
As Sherwin S. from G2 Review puts it, "The AI actions are spot-on, so I can make adjustments fast and see results right away. It's like having an extra set of super-smart hands helping me hit my KPIs."
Analyzing Long-Term Creative Trends
Basic Analysis Methods
To effectively analyze long-term creative trends, start by tracking key performance metrics like CTR (Click-Through Rate), CPM (Cost Per Thousand Impressions), CPC (Cost Per Click), CPA (Cost Per Acquisition), and ROAS (Return on Ad Spend) over time. Use tools like Ads Manager or your preferred analytics platform to create line charts that display performance by creative ID over a 4–12 week period. Applying 7- or 14-day rolling averages helps smooth out daily fluctuations, making it easier to spot real trends. When testing new creative ideas, label each asset clearly (e.g., "UGC-Testimonial-Angle1") to group them into cohorts based on factors like launch date, format, or concept. This allows you to compare how well each group performs in terms of maintaining CTR and stabilizing CPA during their first 7, 14, and 30 days.
Adding placement, audience, and funnel stage into your analysis provides deeper insights. For example:
Top-of-funnel campaigns should focus on metrics like reach, CPM, thumb-stop rate, and CTR.
Mid-funnel efforts should prioritize engagement metrics, CPC, and intent signals such as add-to-cart rates.
Bottom-of-funnel campaigns should center on conversion rate, CPA, and ROAS, especially as frequency increases.
By segmenting your data this way, you can pinpoint which creatives should be scaled up, redirected to different audiences, or retired altogether by prioritizing the right metrics. These visual trends also help you detect early signs of creative fatigue.
Spotting Creative Fatigue and Saturation
Using these time-series insights, you can identify creative fatigue by tracking changes in frequency and engagement. Fatigue often shows up as a pattern over several days: frequency increases (especially above 2–3 for prospecting audiences), CTR declines or plateaus, and CPM, CPC, or CPA rise, even if bids or targeting remain unchanged. Recent trends indicate that Meta's algorithms reward high-quality creatives with lower CPMs, while fatigued creatives face higher costs due to declining engagement. For lead-generation campaigns, effective creatives maintain lower CPMs, whereas fatigued ones experience notable cost increases.
To accurately identify fatigue, rely on rolling averages instead of single-day snapshots. For example, if a creative's 7-day average CTR drops by 30% compared to its initial 7-day average, and CPA increases by 25%, it’s time for a refresh. For remarketing campaigns, you can tolerate higher frequency thresholds (5–7 or more), but still monitor for declining CTR and ROAS over time. This approach minimizes the impact of day-to-day auction variability and ensures you respond to genuine performance shifts.
Using AI for Pattern Recognition
After spotting basic trends and signs of fatigue, advanced AI tools can take your analysis to the next level. AI-powered creative analytics platforms can automatically tag creative elements (e.g., UGC vs. studio content, talking-head videos vs. product demos) and identify which combinations consistently perform well. Tools like AdAmigo.ai can continuously monitor performance, flag fatigue signals (such as CPA exceeding targets for several days or CTR falling below your baseline), and even suggest or deploy new creative variants when thresholds are crossed. These systems learn from your brand’s historical performance, turning insights into actionable strategies by coordinating creatives, budgets, bids, and audience targeting.
As one G2 Review user shared, "These AI actions go beyond simply suggesting actions; they provide valuable insights and justifications. This not only improves my results but also deepens my understanding of campaign optimization."
Turning Insights into a Continuous Creative System
Creating a Creative Testing and Refresh Schedule
To keep your campaigns fresh and effective, it's crucial to align your creative testing schedule with your industry and budget. For fast-paced sectors like beauty, lifestyle, and direct-to-consumer e-commerce, plan to refresh your creatives every 7–10 days, introducing 3–5 new variants each time. Meanwhile, for industries with longer cycles, such as B2B or high-ticket products, a refresh every 3–4 weeks is more appropriate. These updates should include significant changes, like new angles, proof points, or offers.
Dedicate 10–20% of your budget to testing new creatives each week, while the bulk of your spend supports proven performers. During each testing cycle, roll out 3–10 new variations - think different hooks, angles, or formats. Use clear naming conventions to keep things organized, and assess performance after gathering enough data (typically 1–2× your target CPA). From there, promote 1–2 winning creatives to your scale ad sets or Advantage+ stacks. For upper-funnel awareness campaigns, creatives can run longer - 4–8 weeks - as long as reach remains broad and frequency stays below 3–4 exposures per week. However, lower-funnel retargeting assets require more frequent updates due to repeated audience exposure. These regular tests help establish performance benchmarks, which are critical for scaling effectively.
Setting Performance Thresholds and Rules
Once you’ve identified your benchmarks, automated bid rules can take over to enforce them consistently. Establish clear guidelines: scale creatives that outperform control ads by 15–20% in CPA or ROAS over 3–7 days; tweak creatives with strong CTRs but CPAs slightly above target (0–20%) by testing new landing pages, offers, or calls to action; and refresh creatives when CTR drops by 30% and CPA increases by 25% over a 7–14-day period.
Keep an eye on frequency and CPM alongside CTR and conversion rates. If frequency rises while CTR and conversions drop over several days, it’s time for a creative refresh for that audience. Weekly reviews of long-term trends can help you spot signs of fatigue, such as falling CTRs, rising CPMs, or worsening CPAs, so you can act before performance declines further.
Building an Automated Workflow with AI
Using insights from your trend dashboard, you can automate the entire creative process - from testing to scaling - with AdAmigo.ai. This platform tracks performance data, flags signs of fatigue (like rising CPAs or falling CTRs), and deploys new creative variations whenever thresholds are exceeded. The AI Ads Agent analyzes your brand identity, studies your competitors, and identifies your best-performing ads. It even designs and configures new creatives, ready to launch into your ad account with just one click.
To stay on top of things, review AdAmigo.ai's AI Actions daily. Approve suggested budget adjustments, green-light new AI-generated creatives, and address flagged issues, such as increasing CPAs or declining CTRs. The AI Chat Agent provides explanations for performance changes and offers actionable recommendations, like launching fresh ad concepts or refining audience targeting. Weekly, evaluate which creatives have moved from testing to scaling, archive underperformers, and apply key takeaways to your next batch of ideas.
This approach creates a self-sustaining system where your insights build over time, creative quality improves steadily, and your team can focus on strategy while the AI handles the execution.
As Sherwin S. mentioned in a G2 Review, "AdAmigo.ai has been a total game-changer. The AI actions are spot-on, so I can make adjustments fast and see results right away. It's like having an extra set of super-smart hands helping me hit my KPIs."
Conclusion
Keeping an eye on creative trends is key to maintaining strong performance in Meta ads. Studies indicate that about 70–80% of ad success comes from the quality of the creative itself, rather than factors like targeting or budget. By regularly tracking how your creatives perform - weekly and monthly - you not only protect your ROI but also open up opportunities for scalable growth. What separates advertisers who stagnate from those who achieve consistent growth is a repeatable system. This system includes standardized naming conventions, clear metrics (like CPA analysis, CTR, ROAS, and frequency), thresholds for when to pause or scale, and a steady refresh schedule to prevent creative fatigue.
You don’t need a huge team or complicated processes to get started. Focus on key Meta Ads benchmarks, tag your creatives for consistent comparisons, and create a dashboard that tracks 7- and 28-day trends. Establish a simple rule - such as pausing any creative whose CPA increases by 25% above its 28-day average for 3–5 days - and stick to it. This kind of disciplined approach transforms one-off wins into repeatable strategies, giving you a playbook that improves with each quarter.
Once you have this system in place, you can take it to the next level with technology. AI tools like AdAmigo.ai make the process seamless by automating optimization. These tools continuously analyze your ads, generate new creatives based on what’s already working, and provide a daily to-do list of prioritized actions. With features like one-click ad launches, clear recommendations, and an on-demand chat agent to guide your next steps, managing your ad strategy becomes less of a grind and more of a streamlined process.
FAQs
How can I tell if my Meta ad creatives are losing effectiveness?
Keep an eye on indicators such as dropping performance metrics, lower engagement rates, or increasing costs per result. These are often red flags that your ad creatives might be losing their effectiveness.
To tackle this, try leveraging AI tools like AdAmigo.ai. This platform offers daily insights to help you identify trends, detect underperforming creatives, and recommend adjustments. Using tools like these can help you keep your ads fresh and ensure they continue delivering strong results.
What metrics should I track to measure the long-term success of my Meta ad creatives?
To gauge the lasting impact of your Meta ad creatives, it's essential to keep an eye on key performance indicators like Return on Ad Spend (ROAS), click-through rate (CTR), engagement rate, conversion rate, cost per acquisition (CPA), and frequency. These metrics reveal how effectively your ads are performing and help pinpoint which creatives are delivering the best results.
By consistently reviewing these numbers, you can fine-tune your campaigns, improve their effectiveness, and maintain strong performance over the long haul.
How can AI tools like AdAmigo.ai improve Meta ad creative performance and tracking?
AI tools such as AdAmigo.ai make managing Meta ad creatives easier by analyzing trends, automating adjustments, and offering clear, actionable insights. They work as a unified system, fine-tuning creatives, targeting, bids, and budgets to save you time and let you concentrate on strategy.
These tools dive into your brand identity and analyze competitors to create impactful ad creatives. They also enable bulk campaign launches and provide daily improvement suggestions. With features like automated optimization and real-time feedback, they simplify campaign management while helping you get the most out of your ROAS.