
How to Measure Audience Refinement in Meta Ads
Judge Meta audience changes by KPI patterns—efficiency first, then volume and quality—using clean tracking, stable tests, and consistent attribution.
Most audience changes do not fail because of targeting alone. They fail because people judge them too fast or by one metric.
If I want to know whether audience refinement is working, I look for a pattern, not a single number. In plain terms:
If CPA drops and ROAS holds or improves, the change likely helped.
If frequency climbs above 3.0, reach stalls, and CPM goes up, I’m likely hitting the same people too often.
If CTR goes up but conversion rate drops, the problem may be the page or offer, not the audience.
If I compare data before Meta exits the learning phase, I can make the wrong call.
If I change audience, ads, and placements at the same time, I can’t tell what caused the result.
Here’s the short version: set a clean baseline, keep ad sets comparable, review efficiency first, then volume, then quality, and compare the last 14 days to the prior 14 days with the same attribution window. I also wait for delayed reporting, since conversion data can lag by up to 72 hours.
A simple way to think about it: audience refinement is not about making targeting tighter. It’s about deciding whether to expand, hold, cut, or rotate based on what the numbers do together.
To judge that well, I focus on three things:
Tracking: Pixel, Conversions API, deduplication, and event checks
Structure: same ads and placements across audience tests, with overlap under control
Cadence: daily checks for odd spikes, weekly budget shifts, monthly cleanup
That’s the frame I’d use before touching spend.
How to Analyze Facebook Ads Data the Right Way (The 2026 Guide)
Set up a clean measurement foundation
Before you change audiences, make sure your tracking is clean and complete. If the data is shaky, any swing you see after an audience change might come from a tracking hole, not from the audience itself.
Verify Pixel, Conversions API, and key events
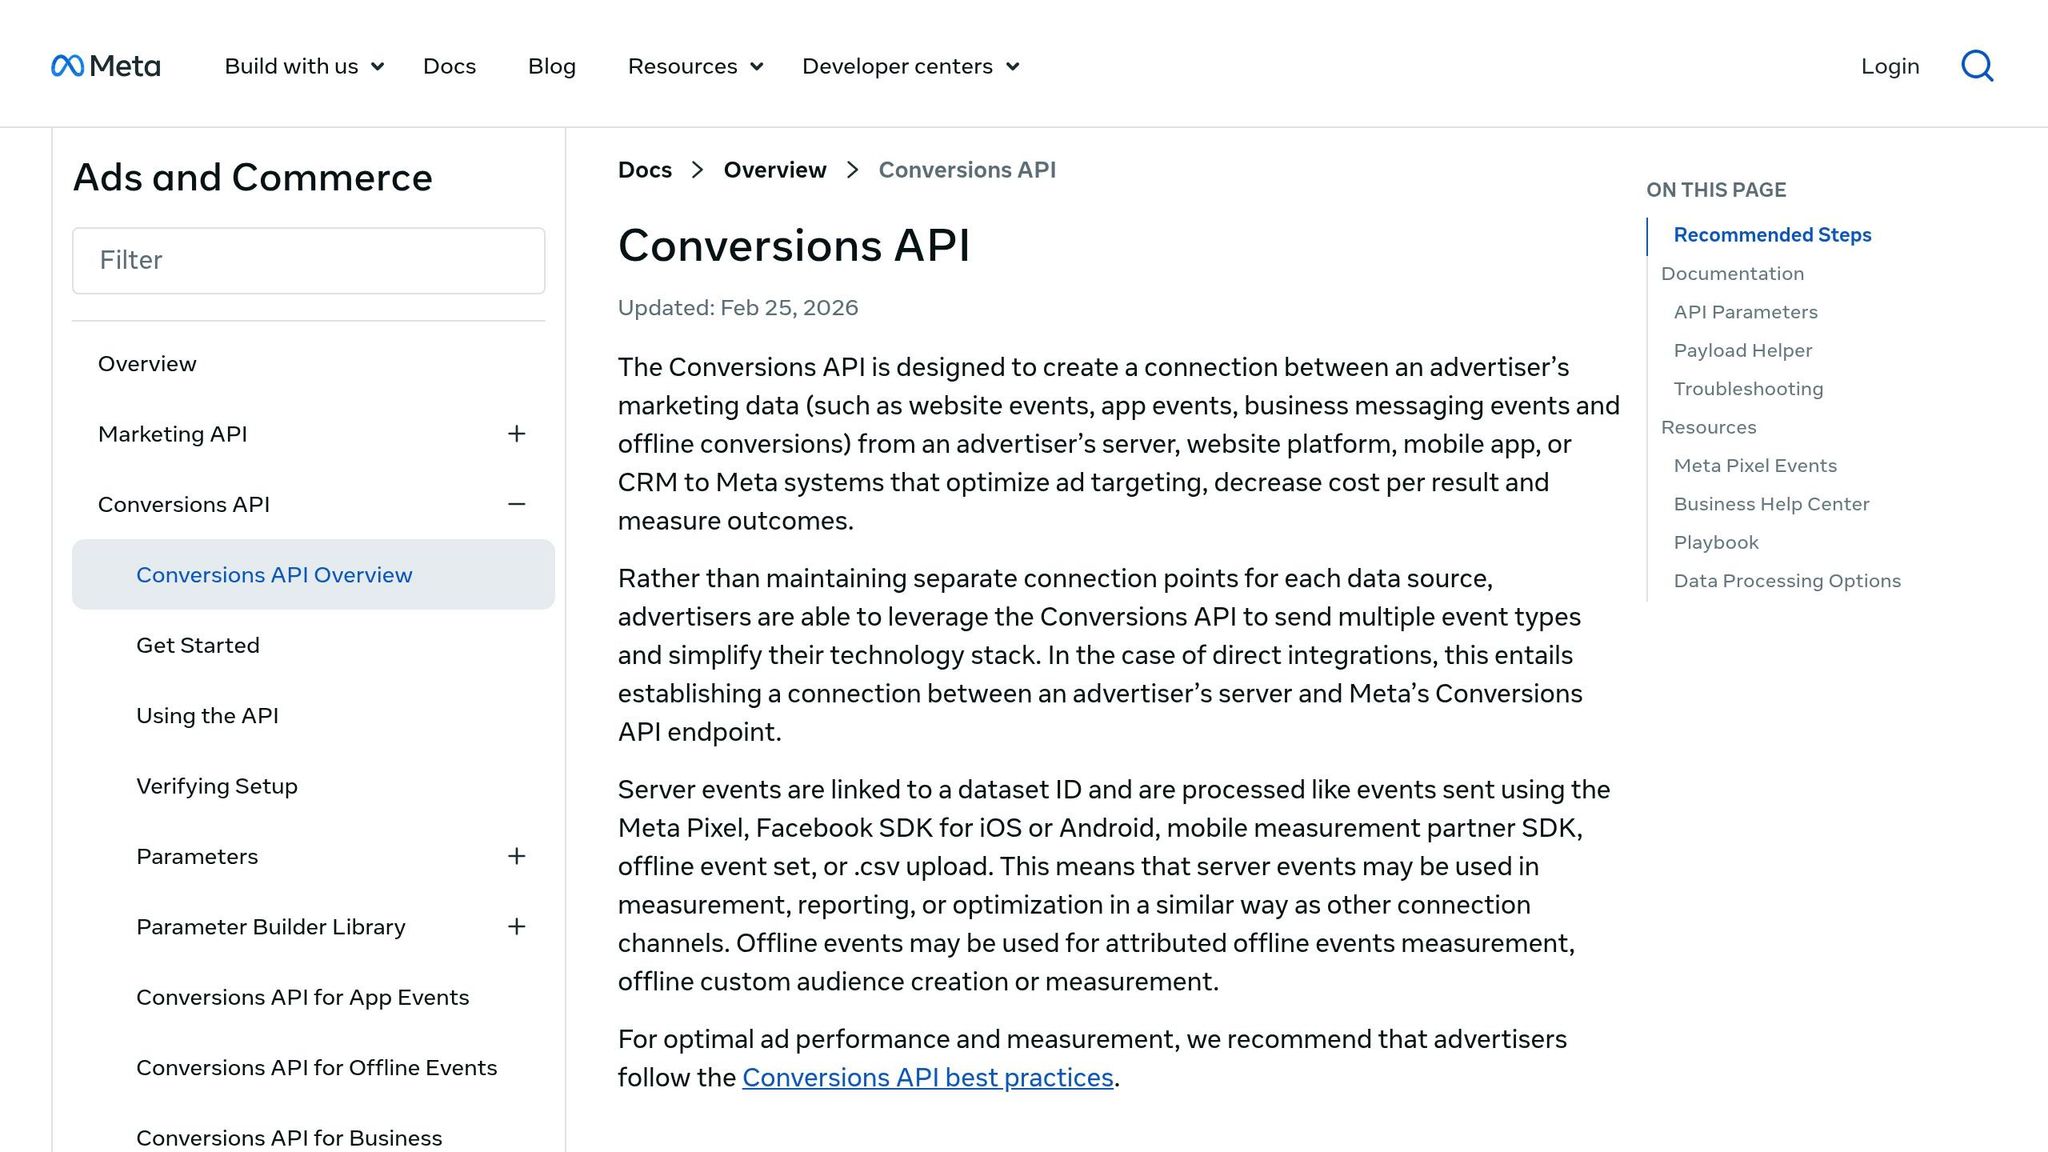
Start with the Meta Pixel Helper Chrome extension. Click through your site and check that events like ViewContent, AddToCart, InitiateCheckout, and Purchase fire on the right pages. Then head to Events Manager and use the "Test Events" tool to confirm that both browser-side signals from Pixel and server-side signals from Conversions API are reaching Meta.
If you're running both at the same time, set up event deduplication with unique event IDs. Otherwise, Meta can count the same conversion twice.
Once tracking checks out, you can judge audience changes based on actual performance shifts.
Structure ad sets so audience performance is comparable
The biggest audience testing mistake is mixing variables. Say you run broad targeting in one ad set and a lookalike in another, but each one uses different creatives or placements. At that point, what changed the result: the audience or the ad? You can't tell.
Keep it clean:
Use the same creatives and placements across ad sets when you're testing audiences.
Split cold prospecting, warm retargeting, and hot retargeting into separate ad sets. That means broad or interest-based traffic for cold, site visitors for warm, and cart abandoners for hot.
Exclude recent purchasers from prospecting campaigns, and exclude retargeting segments from cold audiences, so you don't create overlap and burn spend.
Budgets matter too. If an ad set doesn't have enough spend to gather stable data, the comparison falls apart.
With a clean test setup, KPI movement becomes much easier to compare across audiences.
Match business goals to attribution and reporting windows
Attribution settings are easy to miss, but the damage is real. If your sales cycle takes three days and you're using a 1-day window, you'll undercount conversions. It's that simple.
Use the table below to line up your goal with the right metric and attribution window.
Business Goal | Primary Metric | Attribution Window |
|---|---|---|
eCommerce sales | Purchase ROAS / CAC | 7-day click, 1-day view |
Lead generation | Cost per Lead (CPL) | 30–90 days, based on sales cycle |
High average order value / long cycle | LTV / ROAS | 14–30 days |
App installs | Cost per Install | 1-day click / 1-day view |
With the measurement base set, the next step is reading which KPIs moved and whether the audience change helped.
KPIs that show whether audience refinement is working

Meta Ads KPI Patterns: What Each Signal Means & What to Do Next
Once tracking and attribution are in place, these KPIs help you judge whether an audience change improved scale, efficiency, or quality. Review them in this order: efficiency first (ROAS, CPA), then volume (reach, CPM), then quality (CTR, engagement). That sequence makes it easier to spot the root cause before you touch the audience again.
At the heart of it, you’re answering one thing: did the change improve performance, or did it just move spend around?
Delivery KPIs: Reach, frequency, and CPM
Start with delivery metrics. They usually show saturation before results start to fall off.
Frequency is the clearest early warning sign. If frequency goes up while reach stalls, the audience is probably too small for the budget you’re putting behind it. If CPM climbs at the same time, the auction is getting tighter inside that smaller pool. When you see all three together - flat reach, higher CPM, and higher frequency - it usually points to one move: expand the audience or test a broader segment.
Also watch for reach that stops growing week over week while frequency keeps climbing. That’s a sign the ad set is looping through the same people instead of finding new ones.
Delivery decision: expand, hold, or refresh the audience.
Engagement and conversion KPIs: CTR, CPC, conversion rate, and cost per result
CTR and CPC work best as a pair. Together, they show whether the audience and the ad are pulling in the same direction.
A strong CTR usually means the message is landing with the people seeing it. If CTR is low, test a new hook or try a different audience segment.
Now here’s where it gets interesting: if CTR goes up but CPA also goes up, the audience may be driving clicks without driving conversions. In that case, don’t blame targeting right away. Check the landing page or the offer first.
Engagement decision: change the creative, audience, or landing page.
Revenue and quality KPIs: ROAS, CAC, AOV, and lead quality
Good ad metrics don’t always mean good business results. That’s why ROAS, CAC, AOV, and close rate need to be checked in your CRM or backend data, not just inside Ads Manager.
This is the point where you separate cheap leads from buyers, and decent click numbers from actual revenue.
Revenue decision: keep or kill based on business value.
KPI | What It Signals | Action It Supports |
|---|---|---|
Reach | Audience size and room to scale | If plateauing, broaden targeting or increase lookalike percentage |
Frequency | How fast the audience is getting saturated | Rising frequency with dropping ROAS → rotate creative or expand audience |
CPM | How competitive the auction is | Rising CPM + stable CTR = auction pressure, not audience failure |
CTR | Fit between the ad and the audience | Low CTR → test a new hook or audience segment |
CPC | Cost to bring in traffic | Rising CPC with stable CTR = auction pressure; test different placements or shift budget |
Conversion rate | Quality after the click | Dropping rate with strong CTR = landing page or offer issue |
Cost per result | Spend efficiency | If above target CPA, check the landing page or refine targeting |
ROAS | Profitability | Main metric for scaling or pausing an ad set |
CAC | True cost to acquire a customer | Compare across audience segments using backend data |
AOV | Revenue per order | If low despite high ROAS, shift to value-based lookalikes |
Lead quality / close rate | Revenue potential after the lead comes in | Use CRM data to confirm which audiences bring buyers, not just leads |
Use these patterns to decide whether to broaden, narrow, or hold the audience.
Build a repeatable workflow for audience refinement
Create a saved report at the ad set level
Create one saved ad set report and track ROAS, CPA, reach, CPM, frequency, CTR, conversion rate, learning phase, audience overlap, and CAPI match quality. When a metric shifts, look at the pattern to isolate the cause instead of reacting to one number on its own. If audience overlap is high, consolidate the ad sets.
Once that report is stable, the job changes. Now you're not just watching numbers move. You're reading patterns and using them to spot what's driving performance.
Use KPI patterns to decide what to change
Read metrics in combinations, not in isolation.
Use those combinations as the trigger for change. The call to refine, expand, or pause an audience should come from two or more signals moving in the same direction.
Here are two common patterns and what they usually mean:
High CTR + low conversion rate: The ad is getting clicks, but the audience or the post-click experience isn't turning those clicks into results. Before you change the audience, check the landing page and offer first.
Rising frequency + falling ROAS: This usually points to saturation. The audience is too small for the budget, or the creative has worn out. Expand the audience or rotate the creative.
Filter for learning-complete ad sets before you compare results.
Set a daily, weekly, and monthly refinement cadence
Use the same report on a fixed schedule so every change comes from clean, consistent comparisons.
Daily: Check for anomalies only. Don't act on same-day data; attribution can lag by up to 72 hours.
Weekly: Review the saved report and move budget from weak ad sets to strong ones. Refresh creative if CTR has dropped by more than 20% from its launch baseline or if frequency has gone above 3.0.
Monthly: Retire segments that stay weak over time and refresh customer seeds by creating new custom audiences.
AdAmigo.ai can automate this cadence by auditing performance, flagging anomalies, and executing approved changes.
Conclusion: Judge audience changes by outcomes, not assumptions
Use the same report and the same cadence from the workflow above, and judge each audience change by how the KPIs move together. Audience refinement only works when you measure it in a clear, consistent way. Stick with the same tracking, the same ad set structure, and the same KPI order from the workflow above: efficiency first, then volume, then quality. That order matters because it helps you avoid false calls.
No single metric tells the whole story. A rising CPA can point to creative fatigue, audience saturation, landing-page friction, or auction pressure. On its own, that number doesn't tell you which one is driving the change. The only way to sort that out is to look at how metrics move together.
Once the signal is clear, make sure the ad set is stable before you compare time periods. Wait until the ad set reaches learning complete, then compare the last 14 days with the prior 14 days using the same attribution window.
The goal isn't constant change. Refinement should follow evidence, not guesswork. Test under controlled conditions and judge results against a fixed baseline.
FAQs
How much spend is enough to judge an audience test?
Run each audience segment for at least 7 days and aim for 500 impressions minimum before you make a call.
Then compare CPA, ROAS, and conversion rate against your benchmarks instead of reacting to day-to-day swings. If it fits your setup, AdAmigo.ai can automate account audits and test execution while you stay focused on strategy.
When should I expand an audience instead of refreshing creative?
Expand your audience when click-through rate stays flat while cost per acquisition climbs. That usually points to audience saturation. In plain English: you may be showing ads to the same people too often, and the pool has started to dry up.
Refresh creative when click-through rate is high but cost per acquisition is also high. That’s a sign the ad is getting attention, but something after the click isn’t doing its job. You should also swap in new creative when engagement suggests ad fatigue. If people have seen the same ad too many times, performance can slip even if the targeting is still fine.
AdAmigo.ai can help you figure out which move makes sense next.
How do I measure audience quality beyond Meta metrics?
Go beyond basic Meta metrics and look at what’s happening under the hood. Check operational signals like auction overlap, budget under-pacing, and frequency velocity to catch budget leakage, audience burnout, and ad fatigue early - before they eat into performance.
Then break users into groups based on engagement depth. That can mean time on site, scroll depth, or the type of page they viewed. From there, compare results across demographic and behavioral groups to spot high-value micro-segments that might be easy to miss in a top-line report.
If you want to do this without digging through reports by hand, AdAmigo.ai can automate these audits in real time.